Spanish vs Portuguese Female Unemployment
COMPARE
Spanish
Portuguese
Female Unemployment
Female Unemployment Comparison
Spanish
Portuguese
5.2%
FEMALE UNEMPLOYMENT
55.9/ 100
METRIC RATING
170th/ 347
METRIC RANK
5.3%
FEMALE UNEMPLOYMENT
28.6/ 100
METRIC RATING
192nd/ 347
METRIC RANK
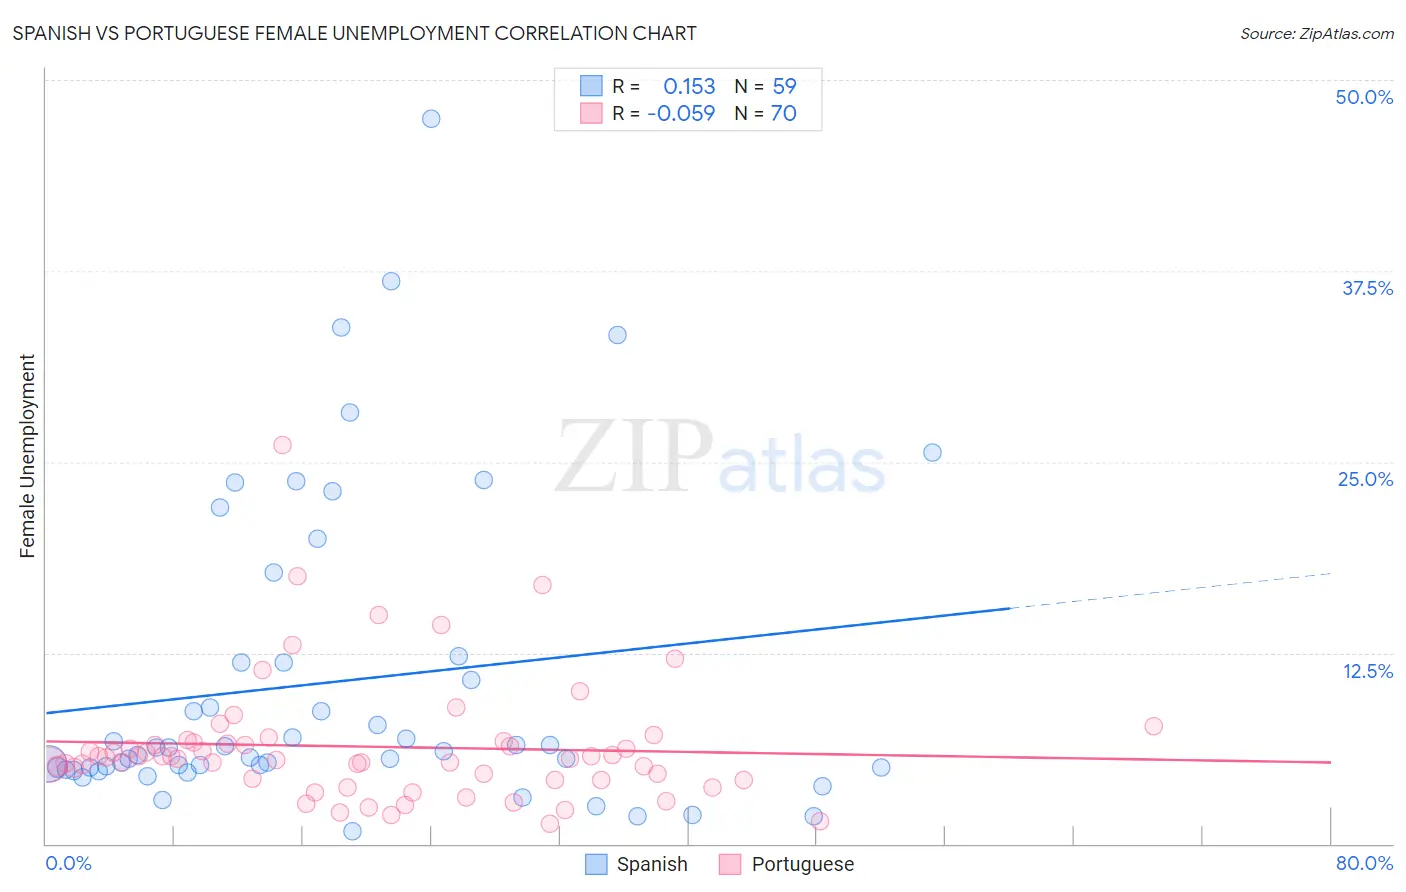
Spanish vs Portuguese Female Unemployment Correlation Chart
The statistical analysis conducted on geographies consisting of 419,412,543 people shows a poor positive correlation between the proportion of Spanish and unemploymnet rate among females in the United States with a correlation coefficient (R) of 0.153 and weighted average of 5.2%. Similarly, the statistical analysis conducted on geographies consisting of 446,764,681 people shows a slight negative correlation between the proportion of Portuguese and unemploymnet rate among females in the United States with a correlation coefficient (R) of -0.059 and weighted average of 5.3%, a difference of 1.7%.
Female Unemployment Correlation Summary
| Measurement | Spanish | Portuguese |
| Minimum | 0.80% | 1.3% |
| Maximum | 47.5% | 26.1% |
| Range | 46.7% | 24.8% |
| Mean | 10.6% | 6.4% |
| Median | 6.1% | 5.6% |
| Interquartile 25% (IQ1) | 5.0% | 4.2% |
| Interquartile 75% (IQ3) | 11.9% | 6.6% |
| Interquartile Range (IQR) | 6.9% | 2.4% |
| Standard Deviation (Sample) | 10.1% | 4.1% |
| Standard Deviation (Population) | 10.0% | 4.1% |
Similar Demographics by Female Unemployment
Demographics Similar to Spanish by Female Unemployment
In terms of female unemployment, the demographic groups most similar to Spanish are Immigrants from Denmark (5.2%, a difference of 0.050%), Immigrants from Chile (5.2%, a difference of 0.19%), Sri Lankan (5.2%, a difference of 0.22%), Immigrants from Uganda (5.3%, a difference of 0.31%), and Iranian (5.3%, a difference of 0.33%).
| Demographics | Rating | Rank | Female Unemployment |
| Immigrants | Asia | 64.3 /100 | #163 | Good 5.2% |
| Bangladeshis | 64.3 /100 | #164 | Good 5.2% |
| Syrians | 62.8 /100 | #165 | Good 5.2% |
| Native Hawaiians | 62.7 /100 | #166 | Good 5.2% |
| Immigrants | Thailand | 62.1 /100 | #167 | Good 5.2% |
| Sri Lankans | 59.4 /100 | #168 | Average 5.2% |
| Immigrants | Chile | 59.0 /100 | #169 | Average 5.2% |
| Spanish | 55.9 /100 | #170 | Average 5.2% |
| Immigrants | Denmark | 55.0 /100 | #171 | Average 5.2% |
| Immigrants | Uganda | 50.7 /100 | #172 | Average 5.3% |
| Iranians | 50.4 /100 | #173 | Average 5.3% |
| Immigrants | Poland | 50.0 /100 | #174 | Average 5.3% |
| Immigrants | Laos | 47.5 /100 | #175 | Average 5.3% |
| Immigrants | Vietnam | 47.5 /100 | #176 | Average 5.3% |
| Immigrants | Morocco | 47.4 /100 | #177 | Average 5.3% |
Demographics Similar to Portuguese by Female Unemployment
In terms of female unemployment, the demographic groups most similar to Portuguese are Arab (5.3%, a difference of 0.070%), Colombian (5.3%, a difference of 0.12%), Cherokee (5.3%, a difference of 0.16%), Ugandan (5.3%, a difference of 0.18%), and Immigrants from Colombia (5.3%, a difference of 0.18%).
| Demographics | Rating | Rank | Female Unemployment |
| Malaysians | 40.1 /100 | #185 | Average 5.3% |
| Immigrants | Belarus | 39.4 /100 | #186 | Fair 5.3% |
| Immigrants | Albania | 35.4 /100 | #187 | Fair 5.3% |
| Afghans | 33.9 /100 | #188 | Fair 5.3% |
| Costa Ricans | 33.8 /100 | #189 | Fair 5.3% |
| Ugandans | 31.2 /100 | #190 | Fair 5.3% |
| Cherokee | 30.8 /100 | #191 | Fair 5.3% |
| Portuguese | 28.6 /100 | #192 | Fair 5.3% |
| Arabs | 27.7 /100 | #193 | Fair 5.3% |
| Colombians | 27.0 /100 | #194 | Fair 5.3% |
| Immigrants | Colombia | 26.2 /100 | #195 | Fair 5.3% |
| Spaniards | 25.2 /100 | #196 | Fair 5.3% |
| Alsatians | 23.9 /100 | #197 | Fair 5.3% |
| Tsimshian | 23.1 /100 | #198 | Fair 5.4% |
| Hawaiians | 22.2 /100 | #199 | Fair 5.4% |