Immigrants from Bangladesh vs Subsaharan African Unemployment Among Ages 30 to 34 years
COMPARE
Immigrants from Bangladesh
Subsaharan African
Unemployment Among Ages 30 to 34 years
Unemployment Among Ages 30 to 34 years Comparison
Immigrants from Bangladesh
Sub-Saharan Africans
6.4%
UNEMPLOYMENT AMONG AGES 30 TO 34 YEARS
0.0/ 100
METRIC RATING
284th/ 347
METRIC RANK
6.0%
UNEMPLOYMENT AMONG AGES 30 TO 34 YEARS
0.3/ 100
METRIC RATING
245th/ 347
METRIC RANK
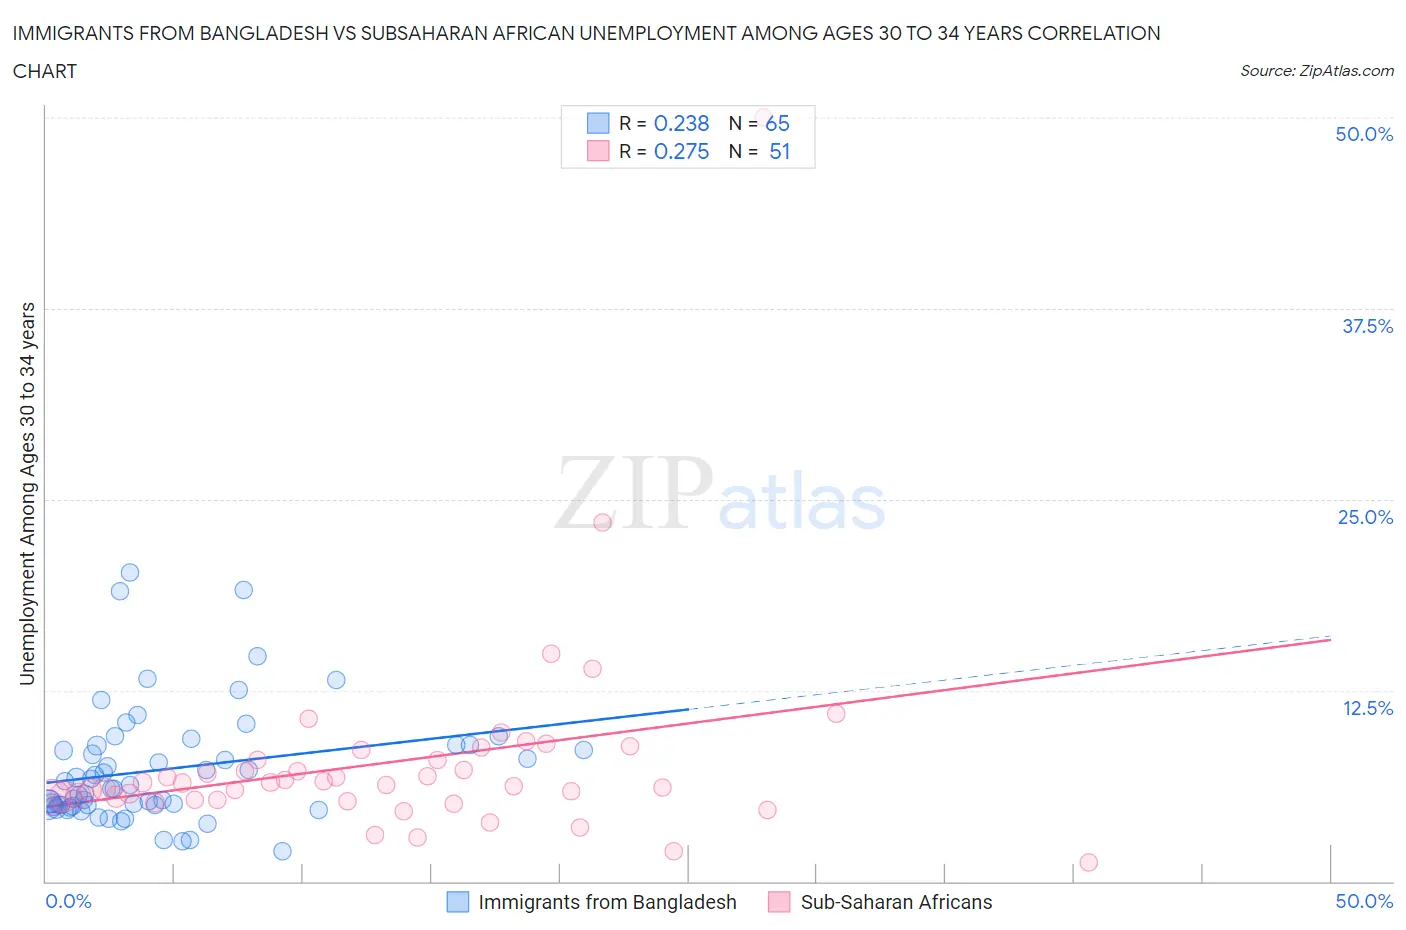
Immigrants from Bangladesh vs Subsaharan African Unemployment Among Ages 30 to 34 years Correlation Chart
The statistical analysis conducted on geographies consisting of 199,135,967 people shows a weak positive correlation between the proportion of Immigrants from Bangladesh and unemployment rate among population between the ages 30 and 34 in the United States with a correlation coefficient (R) of 0.238 and weighted average of 6.4%. Similarly, the statistical analysis conducted on geographies consisting of 466,998,854 people shows a weak positive correlation between the proportion of Sub-Saharan Africans and unemployment rate among population between the ages 30 and 34 in the United States with a correlation coefficient (R) of 0.275 and weighted average of 6.0%, a difference of 7.0%.
Unemployment Among Ages 30 to 34 years Correlation Summary
| Measurement | Immigrants from Bangladesh | Subsaharan African |
| Minimum | 2.0% | 1.2% |
| Maximum | 20.2% | 50.0% |
| Range | 18.2% | 48.8% |
| Mean | 7.3% | 7.8% |
| Median | 6.0% | 6.4% |
| Interquartile 25% (IQ1) | 4.9% | 5.4% |
| Interquartile 75% (IQ3) | 8.9% | 7.9% |
| Interquartile Range (IQR) | 3.9% | 2.6% |
| Standard Deviation (Sample) | 3.8% | 6.9% |
| Standard Deviation (Population) | 3.8% | 6.9% |
Similar Demographics by Unemployment Among Ages 30 to 34 years
Demographics Similar to Immigrants from Bangladesh by Unemployment Among Ages 30 to 34 years
In terms of unemployment among ages 30 to 34 years, the demographic groups most similar to Immigrants from Bangladesh are Hispanic or Latino (6.4%, a difference of 0.060%), African (6.4%, a difference of 0.090%), Choctaw (6.4%, a difference of 0.10%), Central American Indian (6.4%, a difference of 0.14%), and Immigrants from West Indies (6.4%, a difference of 0.17%).
| Demographics | Rating | Rank | Unemployment Among Ages 30 to 34 years |
| Immigrants | Ecuador | 0.0 /100 | #277 | Tragic 6.3% |
| Osage | 0.0 /100 | #278 | Tragic 6.3% |
| Cree | 0.0 /100 | #279 | Tragic 6.4% |
| Cherokee | 0.0 /100 | #280 | Tragic 6.4% |
| Immigrants | Caribbean | 0.0 /100 | #281 | Tragic 6.4% |
| Africans | 0.0 /100 | #282 | Tragic 6.4% |
| Hispanics or Latinos | 0.0 /100 | #283 | Tragic 6.4% |
| Immigrants | Bangladesh | 0.0 /100 | #284 | Tragic 6.4% |
| Choctaw | 0.0 /100 | #285 | Tragic 6.4% |
| Central American Indians | 0.0 /100 | #286 | Tragic 6.4% |
| Immigrants | West Indies | 0.0 /100 | #287 | Tragic 6.4% |
| Senegalese | 0.0 /100 | #288 | Tragic 6.4% |
| Menominee | 0.0 /100 | #289 | Tragic 6.4% |
| Immigrants | Trinidad and Tobago | 0.0 /100 | #290 | Tragic 6.5% |
| Jamaicans | 0.0 /100 | #291 | Tragic 6.5% |
Demographics Similar to Sub-Saharan Africans by Unemployment Among Ages 30 to 34 years
In terms of unemployment among ages 30 to 34 years, the demographic groups most similar to Sub-Saharan Africans are Immigrants from Micronesia (6.0%, a difference of 0.020%), Immigrants from Liberia (6.0%, a difference of 0.18%), Ghanaian (6.0%, a difference of 0.18%), Guatemalan (6.0%, a difference of 0.23%), and Nigerian (6.0%, a difference of 0.25%).
| Demographics | Rating | Rank | Unemployment Among Ages 30 to 34 years |
| Mexican American Indians | 0.6 /100 | #238 | Tragic 5.9% |
| Immigrants | Nigeria | 0.6 /100 | #239 | Tragic 6.0% |
| Salvadorans | 0.5 /100 | #240 | Tragic 6.0% |
| Immigrants | El Salvador | 0.5 /100 | #241 | Tragic 6.0% |
| Guatemalans | 0.4 /100 | #242 | Tragic 6.0% |
| Immigrants | Liberia | 0.4 /100 | #243 | Tragic 6.0% |
| Immigrants | Micronesia | 0.3 /100 | #244 | Tragic 6.0% |
| Sub-Saharan Africans | 0.3 /100 | #245 | Tragic 6.0% |
| Ghanaians | 0.3 /100 | #246 | Tragic 6.0% |
| Nigerians | 0.3 /100 | #247 | Tragic 6.0% |
| Immigrants | Guatemala | 0.3 /100 | #248 | Tragic 6.0% |
| Hondurans | 0.3 /100 | #249 | Tragic 6.0% |
| Immigrants | Honduras | 0.3 /100 | #250 | Tragic 6.0% |
| Tlingit-Haida | 0.2 /100 | #251 | Tragic 6.0% |
| Potawatomi | 0.2 /100 | #252 | Tragic 6.0% |