Spanish American vs Immigrants from South Central Asia Male Unemployment
COMPARE
Spanish American
Immigrants from South Central Asia
Male Unemployment
Male Unemployment Comparison
Spanish Americans
Immigrants from South Central Asia
5.7%
MALE UNEMPLOYMENT
0.3/ 100
METRIC RATING
251st/ 347
METRIC RANK
4.8%
MALE UNEMPLOYMENT
99.9/ 100
METRIC RATING
24th/ 347
METRIC RANK
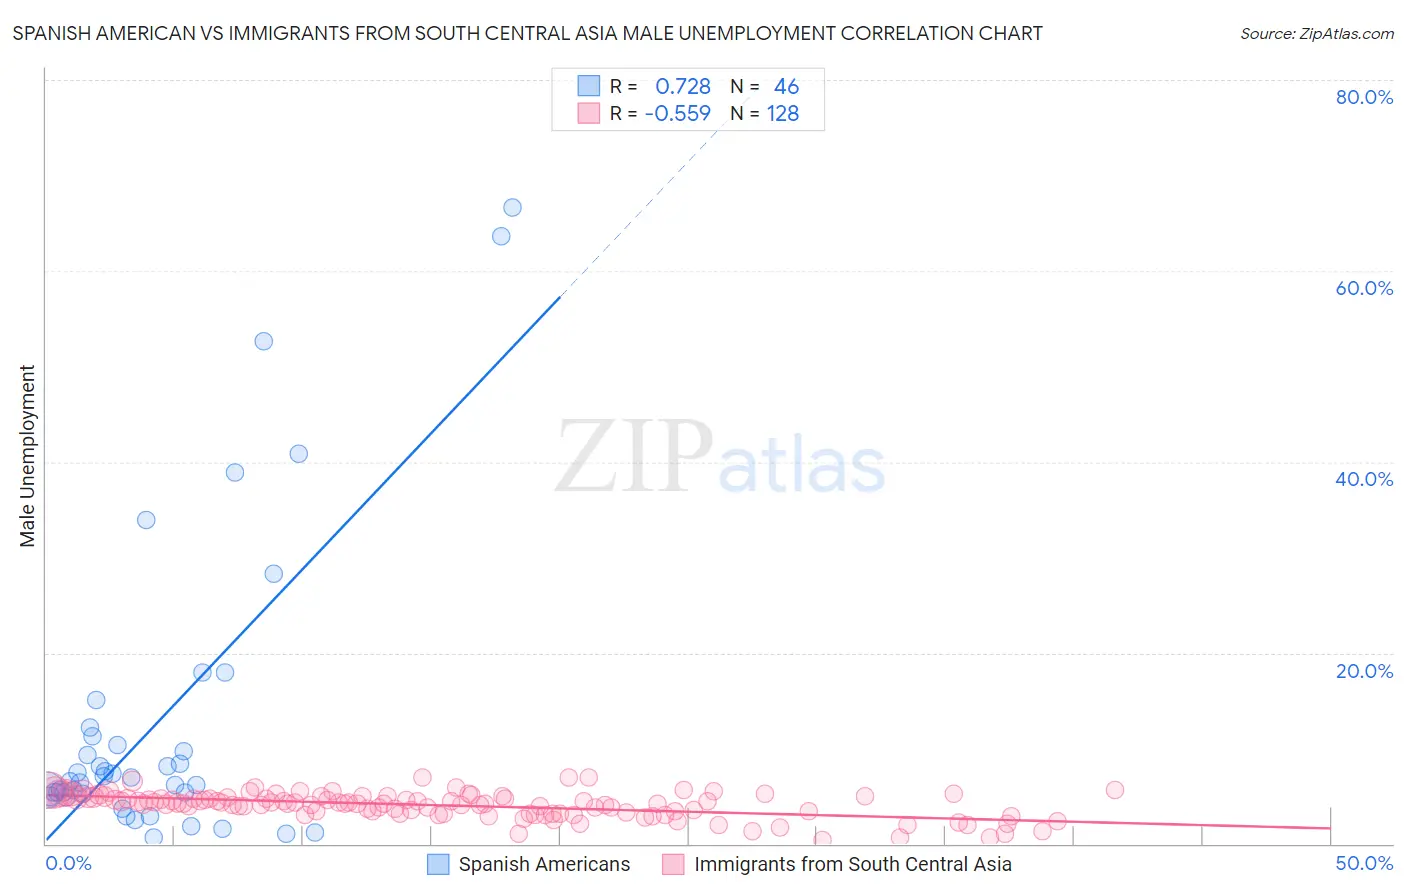
Spanish American vs Immigrants from South Central Asia Male Unemployment Correlation Chart
The statistical analysis conducted on geographies consisting of 103,047,873 people shows a strong positive correlation between the proportion of Spanish Americans and unemployment rate among males in the United States with a correlation coefficient (R) of 0.728 and weighted average of 5.7%. Similarly, the statistical analysis conducted on geographies consisting of 470,335,187 people shows a substantial negative correlation between the proportion of Immigrants from South Central Asia and unemployment rate among males in the United States with a correlation coefficient (R) of -0.559 and weighted average of 4.8%, a difference of 20.1%.
Male Unemployment Correlation Summary
| Measurement | Spanish American | Immigrants from South Central Asia |
| Minimum | 0.60% | 0.40% |
| Maximum | 66.7% | 7.0% |
| Range | 66.1% | 6.6% |
| Mean | 12.8% | 4.0% |
| Median | 6.7% | 4.2% |
| Interquartile 25% (IQ1) | 5.2% | 3.2% |
| Interquartile 75% (IQ3) | 11.3% | 4.9% |
| Interquartile Range (IQR) | 6.1% | 1.7% |
| Standard Deviation (Sample) | 15.8% | 1.3% |
| Standard Deviation (Population) | 15.7% | 1.3% |
Similar Demographics by Male Unemployment
Demographics Similar to Spanish Americans by Male Unemployment
In terms of male unemployment, the demographic groups most similar to Spanish Americans are Immigrants from Bahamas (5.7%, a difference of 0.040%), Cree (5.7%, a difference of 0.29%), Marshallese (5.7%, a difference of 0.36%), Mexican (5.8%, a difference of 0.57%), and Hawaiian (5.7%, a difference of 0.68%).
| Demographics | Rating | Rank | Male Unemployment |
| Immigrants | El Salvador | 0.7 /100 | #244 | Tragic 5.7% |
| Yaqui | 0.7 /100 | #245 | Tragic 5.7% |
| Iroquois | 0.6 /100 | #246 | Tragic 5.7% |
| Hawaiians | 0.6 /100 | #247 | Tragic 5.7% |
| Marshallese | 0.5 /100 | #248 | Tragic 5.7% |
| Cree | 0.4 /100 | #249 | Tragic 5.7% |
| Immigrants | Bahamas | 0.4 /100 | #250 | Tragic 5.7% |
| Spanish Americans | 0.3 /100 | #251 | Tragic 5.7% |
| Mexicans | 0.2 /100 | #252 | Tragic 5.8% |
| Mexican American Indians | 0.2 /100 | #253 | Tragic 5.8% |
| Japanese | 0.2 /100 | #254 | Tragic 5.8% |
| Kiowa | 0.2 /100 | #255 | Tragic 5.8% |
| Comanche | 0.2 /100 | #256 | Tragic 5.8% |
| Hispanics or Latinos | 0.1 /100 | #257 | Tragic 5.8% |
| Dutch West Indians | 0.1 /100 | #258 | Tragic 5.8% |
Demographics Similar to Immigrants from South Central Asia by Male Unemployment
In terms of male unemployment, the demographic groups most similar to Immigrants from South Central Asia are Tongan (4.8%, a difference of 0.030%), Carpatho Rusyn (4.8%, a difference of 0.070%), Immigrants from Taiwan (4.8%, a difference of 0.090%), Zimbabwean (4.8%, a difference of 0.10%), and Dutch (4.8%, a difference of 0.12%).
| Demographics | Rating | Rank | Male Unemployment |
| Filipinos | 99.9 /100 | #17 | Exceptional 4.7% |
| English | 99.9 /100 | #18 | Exceptional 4.8% |
| Europeans | 99.9 /100 | #19 | Exceptional 4.8% |
| Pennsylvania Germans | 99.9 /100 | #20 | Exceptional 4.8% |
| Immigrants | Taiwan | 99.9 /100 | #21 | Exceptional 4.8% |
| Carpatho Rusyns | 99.9 /100 | #22 | Exceptional 4.8% |
| Tongans | 99.9 /100 | #23 | Exceptional 4.8% |
| Immigrants | South Central Asia | 99.9 /100 | #24 | Exceptional 4.8% |
| Zimbabweans | 99.9 /100 | #25 | Exceptional 4.8% |
| Dutch | 99.9 /100 | #26 | Exceptional 4.8% |
| Belgians | 99.9 /100 | #27 | Exceptional 4.8% |
| Bulgarians | 99.8 /100 | #28 | Exceptional 4.8% |
| Scottish | 99.8 /100 | #29 | Exceptional 4.8% |
| British | 99.8 /100 | #30 | Exceptional 4.8% |
| Sudanese | 99.8 /100 | #31 | Exceptional 4.8% |