Lumbee vs Immigrants from West Indies Unemployment Among Ages 25 to 29 years
COMPARE
Lumbee
Immigrants from West Indies
Unemployment Among Ages 25 to 29 years
Unemployment Among Ages 25 to 29 years Comparison
Lumbee
Immigrants from West Indies
11.2%
UNEMPLOYMENT AMONG AGES 25 TO 29 YEARS
0.0/ 100
METRIC RATING
336th/ 347
METRIC RANK
7.8%
UNEMPLOYMENT AMONG AGES 25 TO 29 YEARS
0.0/ 100
METRIC RATING
296th/ 347
METRIC RANK
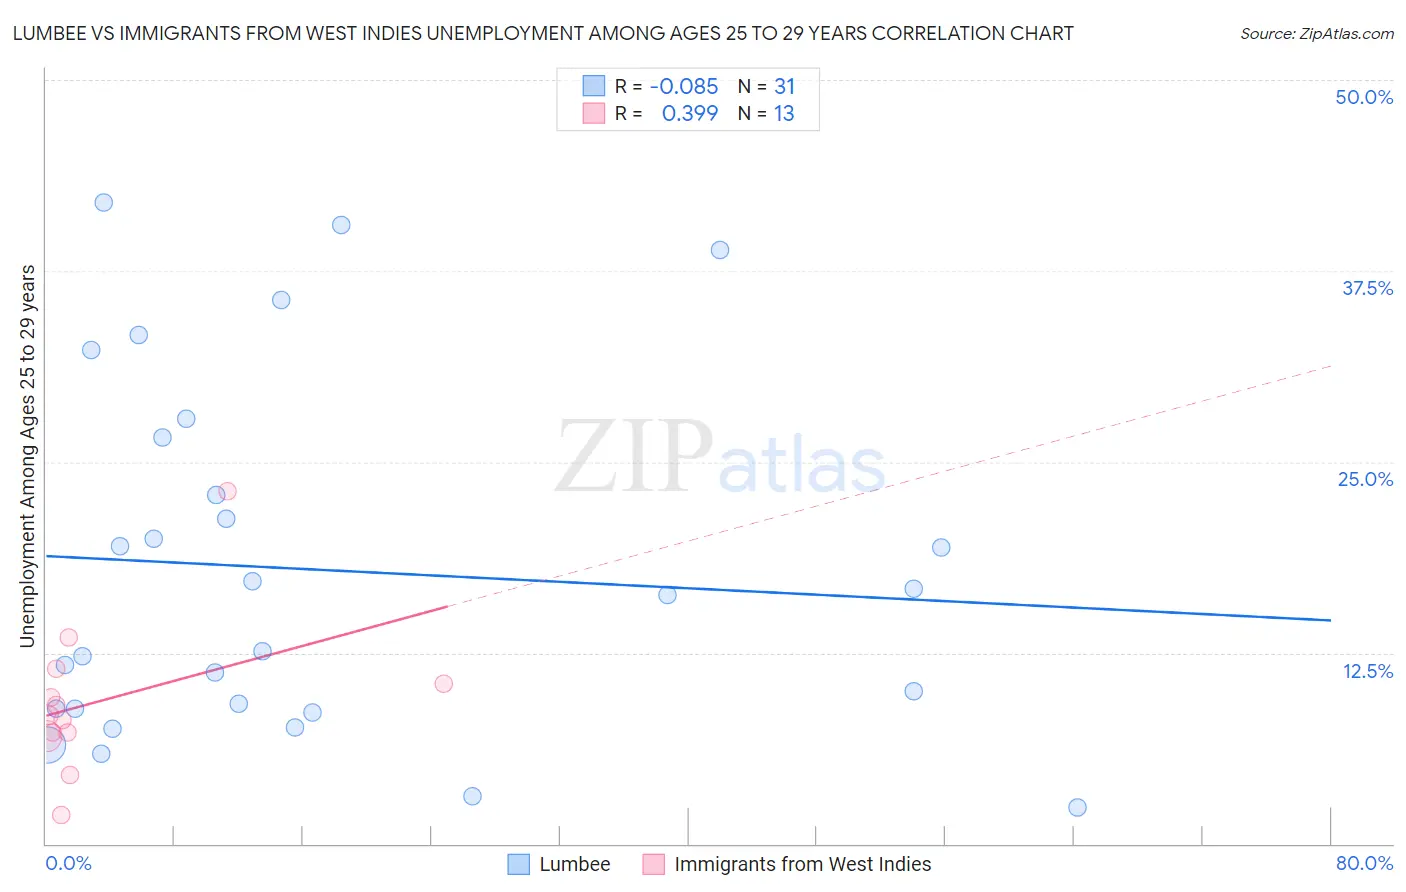
Lumbee vs Immigrants from West Indies Unemployment Among Ages 25 to 29 years Correlation Chart
The statistical analysis conducted on geographies consisting of 90,454,801 people shows a slight negative correlation between the proportion of Lumbee and unemployment rate among population between the ages 25 and 29 in the United States with a correlation coefficient (R) of -0.085 and weighted average of 11.2%. Similarly, the statistical analysis conducted on geographies consisting of 71,747,330 people shows a mild positive correlation between the proportion of Immigrants from West Indies and unemployment rate among population between the ages 25 and 29 in the United States with a correlation coefficient (R) of 0.399 and weighted average of 7.8%, a difference of 43.5%.
Unemployment Among Ages 25 to 29 years Correlation Summary
| Measurement | Lumbee | Immigrants from West Indies |
| Minimum | 2.4% | 1.8% |
| Maximum | 42.0% | 23.1% |
| Range | 39.6% | 21.3% |
| Mean | 17.9% | 9.4% |
| Median | 16.3% | 8.4% |
| Interquartile 25% (IQ1) | 8.8% | 7.2% |
| Interquartile 75% (IQ3) | 26.6% | 11.0% |
| Interquartile Range (IQR) | 17.8% | 3.8% |
| Standard Deviation (Sample) | 11.5% | 5.1% |
| Standard Deviation (Population) | 11.4% | 4.9% |
Similar Demographics by Unemployment Among Ages 25 to 29 years
Demographics Similar to Lumbee by Unemployment Among Ages 25 to 29 years
In terms of unemployment among ages 25 to 29 years, the demographic groups most similar to Lumbee are Menominee (11.3%, a difference of 0.28%), Puerto Rican (11.1%, a difference of 1.1%), Yuman (11.0%, a difference of 2.2%), Sioux (11.7%, a difference of 3.8%), and Alaskan Athabascan (10.8%, a difference of 4.2%).
| Demographics | Rating | Rank | Unemployment Among Ages 25 to 29 years |
| Aleuts | 0.0 /100 | #329 | Tragic 9.7% |
| Natives/Alaskans | 0.0 /100 | #330 | Tragic 9.8% |
| Alaska Natives | 0.0 /100 | #331 | Tragic 10.2% |
| Pueblo | 0.0 /100 | #332 | Tragic 10.4% |
| Alaskan Athabascans | 0.0 /100 | #333 | Tragic 10.8% |
| Yuman | 0.0 /100 | #334 | Tragic 11.0% |
| Puerto Ricans | 0.0 /100 | #335 | Tragic 11.1% |
| Lumbee | 0.0 /100 | #336 | Tragic 11.2% |
| Menominee | 0.0 /100 | #337 | Tragic 11.3% |
| Sioux | 0.0 /100 | #338 | Tragic 11.7% |
| Pima | 0.0 /100 | #339 | Tragic 11.8% |
| Cheyenne | 0.0 /100 | #340 | Tragic 11.8% |
| Tohono O'odham | 0.0 /100 | #341 | Tragic 12.1% |
| Navajo | 0.0 /100 | #342 | Tragic 12.2% |
| Inupiat | 0.0 /100 | #343 | Tragic 13.4% |
Demographics Similar to Immigrants from West Indies by Unemployment Among Ages 25 to 29 years
In terms of unemployment among ages 25 to 29 years, the demographic groups most similar to Immigrants from West Indies are Comanche (7.8%, a difference of 0.13%), Blackfeet (7.9%, a difference of 0.42%), Trinidadian and Tobagonian (7.8%, a difference of 0.59%), Immigrants from Trinidad and Tobago (7.9%, a difference of 0.68%), and Barbadian (7.9%, a difference of 0.86%).
| Demographics | Rating | Rank | Unemployment Among Ages 25 to 29 years |
| Belizeans | 0.0 /100 | #289 | Tragic 7.7% |
| Armenians | 0.0 /100 | #290 | Tragic 7.7% |
| Hispanics or Latinos | 0.0 /100 | #291 | Tragic 7.7% |
| Chippewa | 0.0 /100 | #292 | Tragic 7.8% |
| Immigrants | Belize | 0.0 /100 | #293 | Tragic 7.8% |
| Trinidadians and Tobagonians | 0.0 /100 | #294 | Tragic 7.8% |
| Comanche | 0.0 /100 | #295 | Tragic 7.8% |
| Immigrants | West Indies | 0.0 /100 | #296 | Tragic 7.8% |
| Blackfeet | 0.0 /100 | #297 | Tragic 7.9% |
| Immigrants | Trinidad and Tobago | 0.0 /100 | #298 | Tragic 7.9% |
| Barbadians | 0.0 /100 | #299 | Tragic 7.9% |
| Central American Indians | 0.0 /100 | #300 | Tragic 7.9% |
| West Indians | 0.0 /100 | #301 | Tragic 7.9% |
| Jamaicans | 0.0 /100 | #302 | Tragic 7.9% |
| Immigrants | Yemen | 0.0 /100 | #303 | Tragic 8.0% |