Immigrants from South Africa vs Immigrants from West Indies Unemployment Among Ages 25 to 29 years
COMPARE
Immigrants from South Africa
Immigrants from West Indies
Unemployment Among Ages 25 to 29 years
Unemployment Among Ages 25 to 29 years Comparison
Immigrants from South Africa
Immigrants from West Indies
6.5%
UNEMPLOYMENT AMONG AGES 25 TO 29 YEARS
84.9/ 100
METRIC RATING
119th/ 347
METRIC RANK
7.8%
UNEMPLOYMENT AMONG AGES 25 TO 29 YEARS
0.0/ 100
METRIC RATING
296th/ 347
METRIC RANK
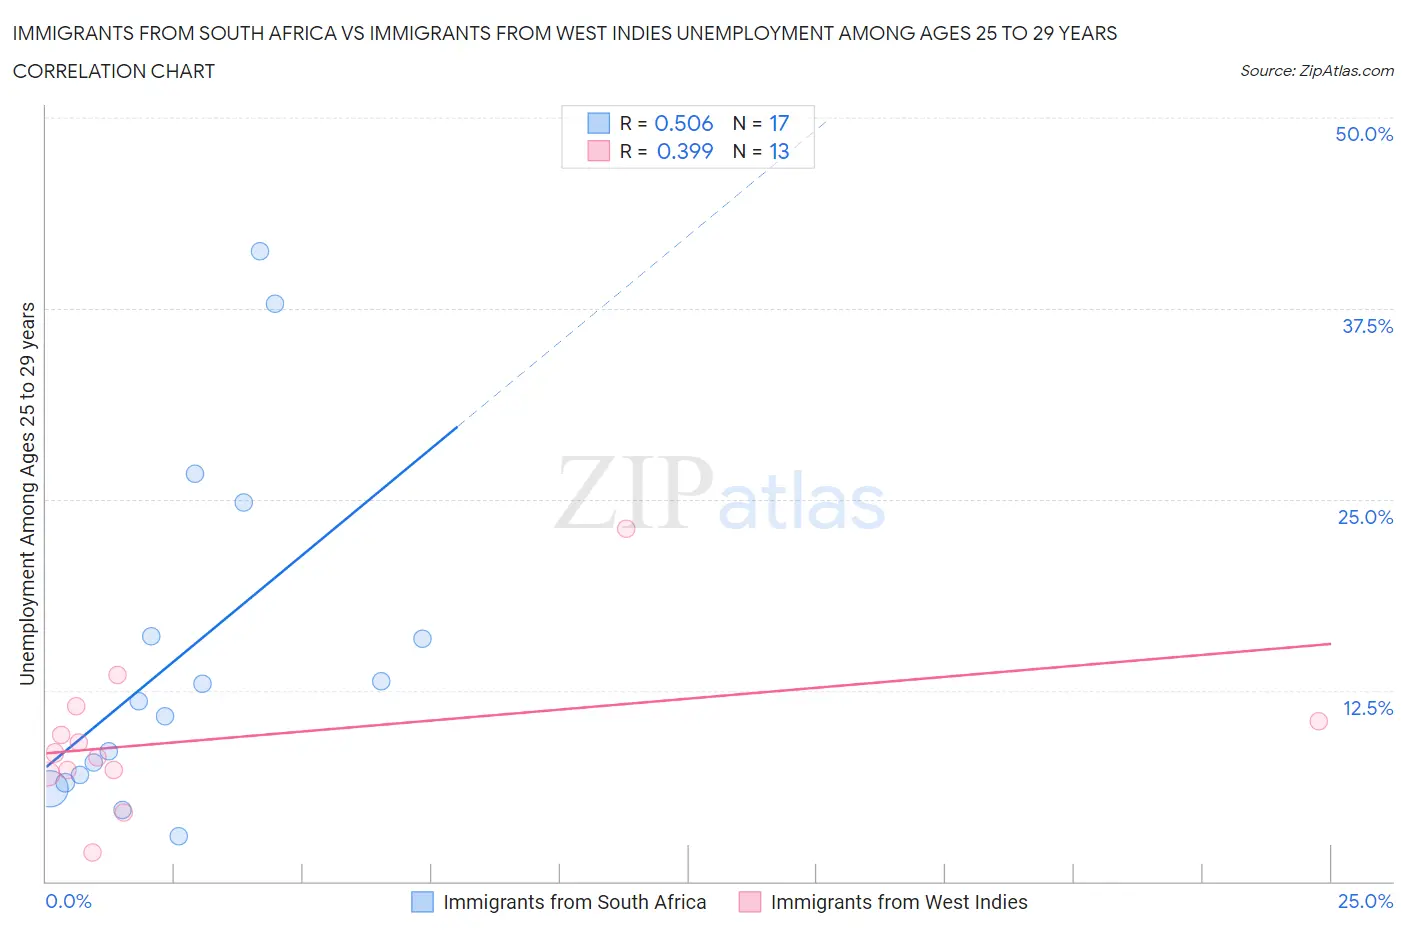
Immigrants from South Africa vs Immigrants from West Indies Unemployment Among Ages 25 to 29 years Correlation Chart
The statistical analysis conducted on geographies consisting of 224,751,568 people shows a substantial positive correlation between the proportion of Immigrants from South Africa and unemployment rate among population between the ages 25 and 29 in the United States with a correlation coefficient (R) of 0.506 and weighted average of 6.5%. Similarly, the statistical analysis conducted on geographies consisting of 71,747,330 people shows a mild positive correlation between the proportion of Immigrants from West Indies and unemployment rate among population between the ages 25 and 29 in the United States with a correlation coefficient (R) of 0.399 and weighted average of 7.8%, a difference of 21.1%.
Unemployment Among Ages 25 to 29 years Correlation Summary
| Measurement | Immigrants from South Africa | Immigrants from West Indies |
| Minimum | 3.0% | 1.8% |
| Maximum | 41.2% | 23.1% |
| Range | 38.2% | 21.3% |
| Mean | 15.0% | 9.4% |
| Median | 11.8% | 8.4% |
| Interquartile 25% (IQ1) | 6.7% | 7.2% |
| Interquartile 75% (IQ3) | 20.4% | 11.0% |
| Interquartile Range (IQR) | 13.7% | 3.8% |
| Standard Deviation (Sample) | 11.3% | 5.1% |
| Standard Deviation (Population) | 11.0% | 4.9% |
Similar Demographics by Unemployment Among Ages 25 to 29 years
Demographics Similar to Immigrants from South Africa by Unemployment Among Ages 25 to 29 years
In terms of unemployment among ages 25 to 29 years, the demographic groups most similar to Immigrants from South Africa are Chilean (6.5%, a difference of 0.050%), Immigrants from Moldova (6.5%, a difference of 0.050%), Immigrants from Uganda (6.5%, a difference of 0.050%), Immigrants from Uruguay (6.5%, a difference of 0.10%), and Pakistani (6.5%, a difference of 0.12%).
| Demographics | Rating | Rank | Unemployment Among Ages 25 to 29 years |
| Immigrants | Nicaragua | 87.5 /100 | #112 | Excellent 6.4% |
| Immigrants | Egypt | 87.1 /100 | #113 | Excellent 6.5% |
| Germans | 86.3 /100 | #114 | Excellent 6.5% |
| Macedonians | 86.1 /100 | #115 | Excellent 6.5% |
| Pakistanis | 85.9 /100 | #116 | Excellent 6.5% |
| Immigrants | Uruguay | 85.7 /100 | #117 | Excellent 6.5% |
| Chileans | 85.3 /100 | #118 | Excellent 6.5% |
| Immigrants | South Africa | 84.9 /100 | #119 | Excellent 6.5% |
| Immigrants | Moldova | 84.5 /100 | #120 | Excellent 6.5% |
| Immigrants | Uganda | 84.5 /100 | #121 | Excellent 6.5% |
| Immigrants | Belarus | 83.7 /100 | #122 | Excellent 6.5% |
| Laotians | 83.6 /100 | #123 | Excellent 6.5% |
| Arabs | 82.5 /100 | #124 | Excellent 6.5% |
| Syrians | 82.1 /100 | #125 | Excellent 6.5% |
| Brazilians | 81.9 /100 | #126 | Excellent 6.5% |
Demographics Similar to Immigrants from West Indies by Unemployment Among Ages 25 to 29 years
In terms of unemployment among ages 25 to 29 years, the demographic groups most similar to Immigrants from West Indies are Comanche (7.8%, a difference of 0.13%), Blackfeet (7.9%, a difference of 0.42%), Trinidadian and Tobagonian (7.8%, a difference of 0.59%), Immigrants from Trinidad and Tobago (7.9%, a difference of 0.68%), and Barbadian (7.9%, a difference of 0.86%).
| Demographics | Rating | Rank | Unemployment Among Ages 25 to 29 years |
| Belizeans | 0.0 /100 | #289 | Tragic 7.7% |
| Armenians | 0.0 /100 | #290 | Tragic 7.7% |
| Hispanics or Latinos | 0.0 /100 | #291 | Tragic 7.7% |
| Chippewa | 0.0 /100 | #292 | Tragic 7.8% |
| Immigrants | Belize | 0.0 /100 | #293 | Tragic 7.8% |
| Trinidadians and Tobagonians | 0.0 /100 | #294 | Tragic 7.8% |
| Comanche | 0.0 /100 | #295 | Tragic 7.8% |
| Immigrants | West Indies | 0.0 /100 | #296 | Tragic 7.8% |
| Blackfeet | 0.0 /100 | #297 | Tragic 7.9% |
| Immigrants | Trinidad and Tobago | 0.0 /100 | #298 | Tragic 7.9% |
| Barbadians | 0.0 /100 | #299 | Tragic 7.9% |
| Central American Indians | 0.0 /100 | #300 | Tragic 7.9% |
| West Indians | 0.0 /100 | #301 | Tragic 7.9% |
| Jamaicans | 0.0 /100 | #302 | Tragic 7.9% |
| Immigrants | Yemen | 0.0 /100 | #303 | Tragic 8.0% |