Spaniard vs Austrian Unemployment Among Women with Children Ages 6 to 17 years
COMPARE
Spaniard
Austrian
Unemployment Among Women with Children Ages 6 to 17 years
Unemployment Among Women with Children Ages 6 to 17 years Comparison
Spaniards
Austrians
9.2%
UNEMPLOYMENT AMONG WOMEN WITH CHILDREN AGES 6 TO 17 YEARS
8.2/ 100
METRIC RATING
213th/ 347
METRIC RANK
9.1%
UNEMPLOYMENT AMONG WOMEN WITH CHILDREN AGES 6 TO 17 YEARS
25.0/ 100
METRIC RATING
195th/ 347
METRIC RANK
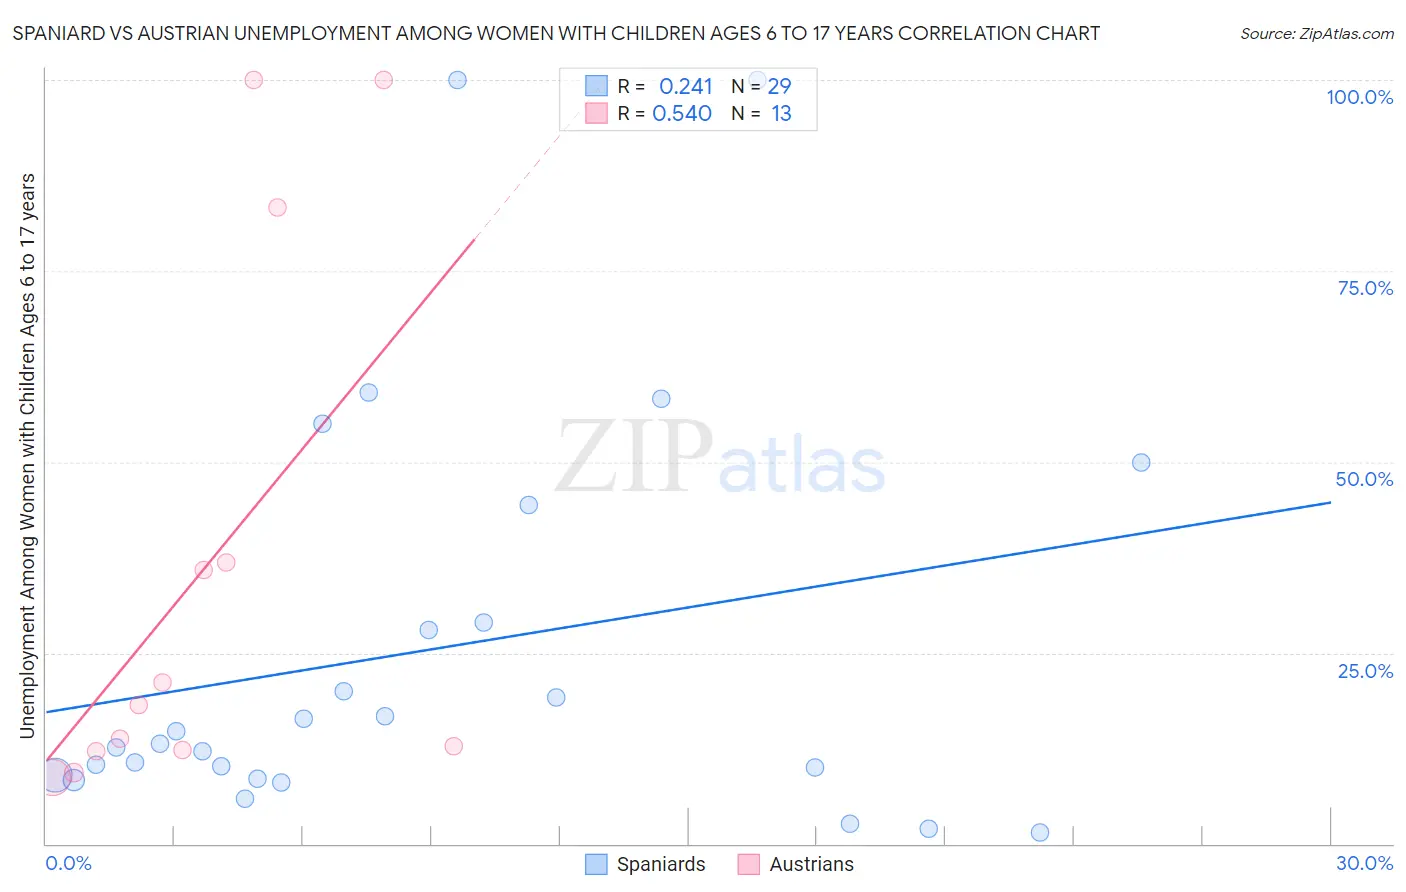
Spaniard vs Austrian Unemployment Among Women with Children Ages 6 to 17 years Correlation Chart
The statistical analysis conducted on geographies consisting of 311,847,590 people shows a weak positive correlation between the proportion of Spaniards and unemployment rate among women with children between the ages 6 and 17 in the United States with a correlation coefficient (R) of 0.241 and weighted average of 9.2%. Similarly, the statistical analysis conducted on geographies consisting of 303,706,966 people shows a substantial positive correlation between the proportion of Austrians and unemployment rate among women with children between the ages 6 and 17 in the United States with a correlation coefficient (R) of 0.540 and weighted average of 9.1%, a difference of 1.5%.
Unemployment Among Women with Children Ages 6 to 17 years Correlation Summary
| Measurement | Spaniard | Austrian |
| Minimum | 1.4% | 8.6% |
| Maximum | 100.0% | 100.0% |
| Range | 98.6% | 91.4% |
| Mean | 25.4% | 35.7% |
| Median | 13.1% | 18.2% |
| Interquartile 25% (IQ1) | 8.7% | 12.1% |
| Interquartile 75% (IQ3) | 36.7% | 60.1% |
| Interquartile Range (IQR) | 27.9% | 48.0% |
| Standard Deviation (Sample) | 26.8% | 34.9% |
| Standard Deviation (Population) | 26.3% | 33.5% |
Demographics Similar to Spaniards and Austrians by Unemployment Among Women with Children Ages 6 to 17 years
In terms of unemployment among women with children ages 6 to 17 years, the demographic groups most similar to Spaniards are Iroquois (9.2%, a difference of 0.10%), Peruvian (9.2%, a difference of 0.11%), Immigrants from Cuba (9.2%, a difference of 0.19%), Finnish (9.2%, a difference of 0.24%), and Salvadoran (9.2%, a difference of 0.33%). Similarly, the demographic groups most similar to Austrians are Immigrants from Kazakhstan (9.1%, a difference of 0.020%), Brazilian (9.1%, a difference of 0.030%), Immigrants from Panama (9.1%, a difference of 0.040%), Guyanese (9.1%, a difference of 0.19%), and Czechoslovakian (9.1%, a difference of 0.26%).
| Demographics | Rating | Rank | Unemployment Among Women with Children Ages 6 to 17 years |
| Immigrants | Kazakhstan | 25.3 /100 | #194 | Fair 9.1% |
| Austrians | 25.0 /100 | #195 | Fair 9.1% |
| Brazilians | 24.4 /100 | #196 | Fair 9.1% |
| Immigrants | Panama | 24.3 /100 | #197 | Fair 9.1% |
| Guyanese | 21.8 /100 | #198 | Fair 9.1% |
| Czechoslovakians | 20.8 /100 | #199 | Fair 9.1% |
| Trinidadians and Tobagonians | 18.2 /100 | #200 | Poor 9.1% |
| Immigrants | Trinidad and Tobago | 16.7 /100 | #201 | Poor 9.1% |
| Immigrants | Middle Africa | 15.6 /100 | #202 | Poor 9.1% |
| Maltese | 15.3 /100 | #203 | Poor 9.1% |
| Immigrants | Canada | 15.3 /100 | #204 | Poor 9.1% |
| Immigrants | Western Europe | 14.1 /100 | #205 | Poor 9.1% |
| Immigrants | North America | 12.7 /100 | #206 | Poor 9.2% |
| Cubans | 10.9 /100 | #207 | Poor 9.2% |
| Immigrants | Peru | 10.8 /100 | #208 | Poor 9.2% |
| Salvadorans | 10.7 /100 | #209 | Poor 9.2% |
| Finns | 10.0 /100 | #210 | Tragic 9.2% |
| Immigrants | Cuba | 9.6 /100 | #211 | Tragic 9.2% |
| Peruvians | 9.0 /100 | #212 | Tragic 9.2% |
| Spaniards | 8.2 /100 | #213 | Tragic 9.2% |
| Iroquois | 7.5 /100 | #214 | Tragic 9.2% |