Immigrants from Japan vs Barbadian Unemployment Among Women with Children Ages 6 to 17 years
COMPARE
Immigrants from Japan
Barbadian
Unemployment Among Women with Children Ages 6 to 17 years
Unemployment Among Women with Children Ages 6 to 17 years Comparison
Immigrants from Japan
Barbadians
8.2%
UNEMPLOYMENT AMONG WOMEN WITH CHILDREN AGES 6 TO 17 YEARS
100.0/ 100
METRIC RATING
55th/ 347
METRIC RANK
8.7%
UNEMPLOYMENT AMONG WOMEN WITH CHILDREN AGES 6 TO 17 YEARS
93.8/ 100
METRIC RATING
129th/ 347
METRIC RANK
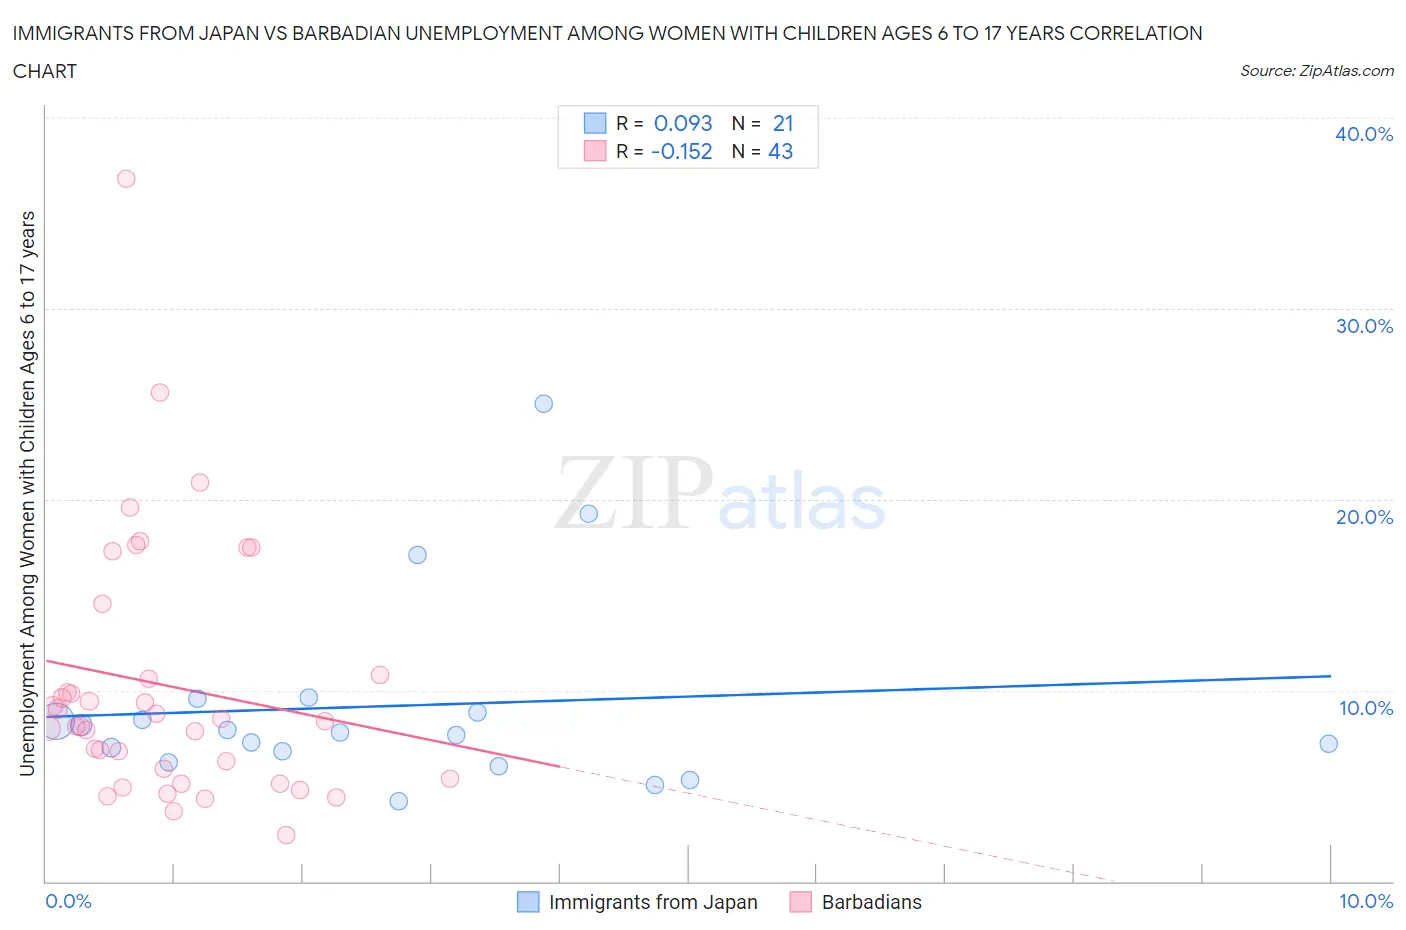
Immigrants from Japan vs Barbadian Unemployment Among Women with Children Ages 6 to 17 years Correlation Chart
The statistical analysis conducted on geographies consisting of 254,422,698 people shows a slight positive correlation between the proportion of Immigrants from Japan and unemployment rate among women with children between the ages 6 and 17 in the United States with a correlation coefficient (R) of 0.093 and weighted average of 8.2%. Similarly, the statistical analysis conducted on geographies consisting of 121,323,299 people shows a poor negative correlation between the proportion of Barbadians and unemployment rate among women with children between the ages 6 and 17 in the United States with a correlation coefficient (R) of -0.152 and weighted average of 8.7%, a difference of 6.5%.
Unemployment Among Women with Children Ages 6 to 17 years Correlation Summary
| Measurement | Immigrants from Japan | Barbadian |
| Minimum | 4.2% | 2.4% |
| Maximum | 25.0% | 36.8% |
| Range | 20.8% | 34.4% |
| Mean | 9.2% | 10.2% |
| Median | 7.8% | 8.4% |
| Interquartile 25% (IQ1) | 6.5% | 5.4% |
| Interquartile 75% (IQ3) | 9.2% | 10.8% |
| Interquartile Range (IQR) | 2.7% | 5.4% |
| Standard Deviation (Sample) | 5.1% | 6.7% |
| Standard Deviation (Population) | 5.0% | 6.7% |
Similar Demographics by Unemployment Among Women with Children Ages 6 to 17 years
Demographics Similar to Immigrants from Japan by Unemployment Among Women with Children Ages 6 to 17 years
In terms of unemployment among women with children ages 6 to 17 years, the demographic groups most similar to Immigrants from Japan are Immigrants from Bosnia and Herzegovina (8.2%, a difference of 0.010%), Immigrants from Laos (8.2%, a difference of 0.030%), Immigrants from Armenia (8.2%, a difference of 0.060%), Immigrants from Malaysia (8.2%, a difference of 0.23%), and Danish (8.1%, a difference of 0.29%).
| Demographics | Rating | Rank | Unemployment Among Women with Children Ages 6 to 17 years |
| Immigrants | Asia | 100.0 /100 | #48 | Exceptional 8.1% |
| Immigrants | Oceania | 100.0 /100 | #49 | Exceptional 8.1% |
| Hawaiians | 100.0 /100 | #50 | Exceptional 8.1% |
| Immigrants | Sudan | 100.0 /100 | #51 | Exceptional 8.1% |
| Immigrants | Iraq | 100.0 /100 | #52 | Exceptional 8.1% |
| Danes | 100.0 /100 | #53 | Exceptional 8.1% |
| Immigrants | Armenia | 100.0 /100 | #54 | Exceptional 8.2% |
| Immigrants | Japan | 100.0 /100 | #55 | Exceptional 8.2% |
| Immigrants | Bosnia and Herzegovina | 100.0 /100 | #56 | Exceptional 8.2% |
| Immigrants | Laos | 100.0 /100 | #57 | Exceptional 8.2% |
| Immigrants | Malaysia | 100.0 /100 | #58 | Exceptional 8.2% |
| Immigrants | Philippines | 100.0 /100 | #59 | Exceptional 8.2% |
| Basques | 100.0 /100 | #60 | Exceptional 8.2% |
| Koreans | 100.0 /100 | #61 | Exceptional 8.2% |
| Spanish American Indians | 100.0 /100 | #62 | Exceptional 8.2% |
Demographics Similar to Barbadians by Unemployment Among Women with Children Ages 6 to 17 years
In terms of unemployment among women with children ages 6 to 17 years, the demographic groups most similar to Barbadians are Hmong (8.7%, a difference of 0.10%), Immigrants from Northern Africa (8.7%, a difference of 0.12%), Czech (8.7%, a difference of 0.12%), Immigrants from Western Asia (8.7%, a difference of 0.14%), and South African (8.7%, a difference of 0.15%).
| Demographics | Rating | Rank | Unemployment Among Women with Children Ages 6 to 17 years |
| Immigrants | Egypt | 95.0 /100 | #122 | Exceptional 8.7% |
| Immigrants | Morocco | 94.9 /100 | #123 | Exceptional 8.7% |
| Immigrants | Lebanon | 94.9 /100 | #124 | Exceptional 8.7% |
| South Africans | 94.6 /100 | #125 | Exceptional 8.7% |
| Immigrants | Northern Africa | 94.4 /100 | #126 | Exceptional 8.7% |
| Czechs | 94.4 /100 | #127 | Exceptional 8.7% |
| Hmong | 94.3 /100 | #128 | Exceptional 8.7% |
| Barbadians | 93.8 /100 | #129 | Exceptional 8.7% |
| Immigrants | Western Asia | 93.1 /100 | #130 | Exceptional 8.7% |
| Slavs | 92.2 /100 | #131 | Exceptional 8.7% |
| Yaqui | 92.2 /100 | #132 | Exceptional 8.7% |
| Egyptians | 91.8 /100 | #133 | Exceptional 8.7% |
| Immigrants | Ireland | 91.0 /100 | #134 | Exceptional 8.7% |
| Europeans | 90.6 /100 | #135 | Exceptional 8.7% |
| Immigrants | Latvia | 90.4 /100 | #136 | Exceptional 8.7% |