Icelander vs Afghan Male Unemployment
COMPARE
Icelander
Afghan
Male Unemployment
Male Unemployment Comparison
Icelanders
Afghans
5.0%
MALE UNEMPLOYMENT
97.6/ 100
METRIC RATING
65th/ 347
METRIC RANK
5.3%
MALE UNEMPLOYMENT
62.0/ 100
METRIC RATING
164th/ 347
METRIC RANK
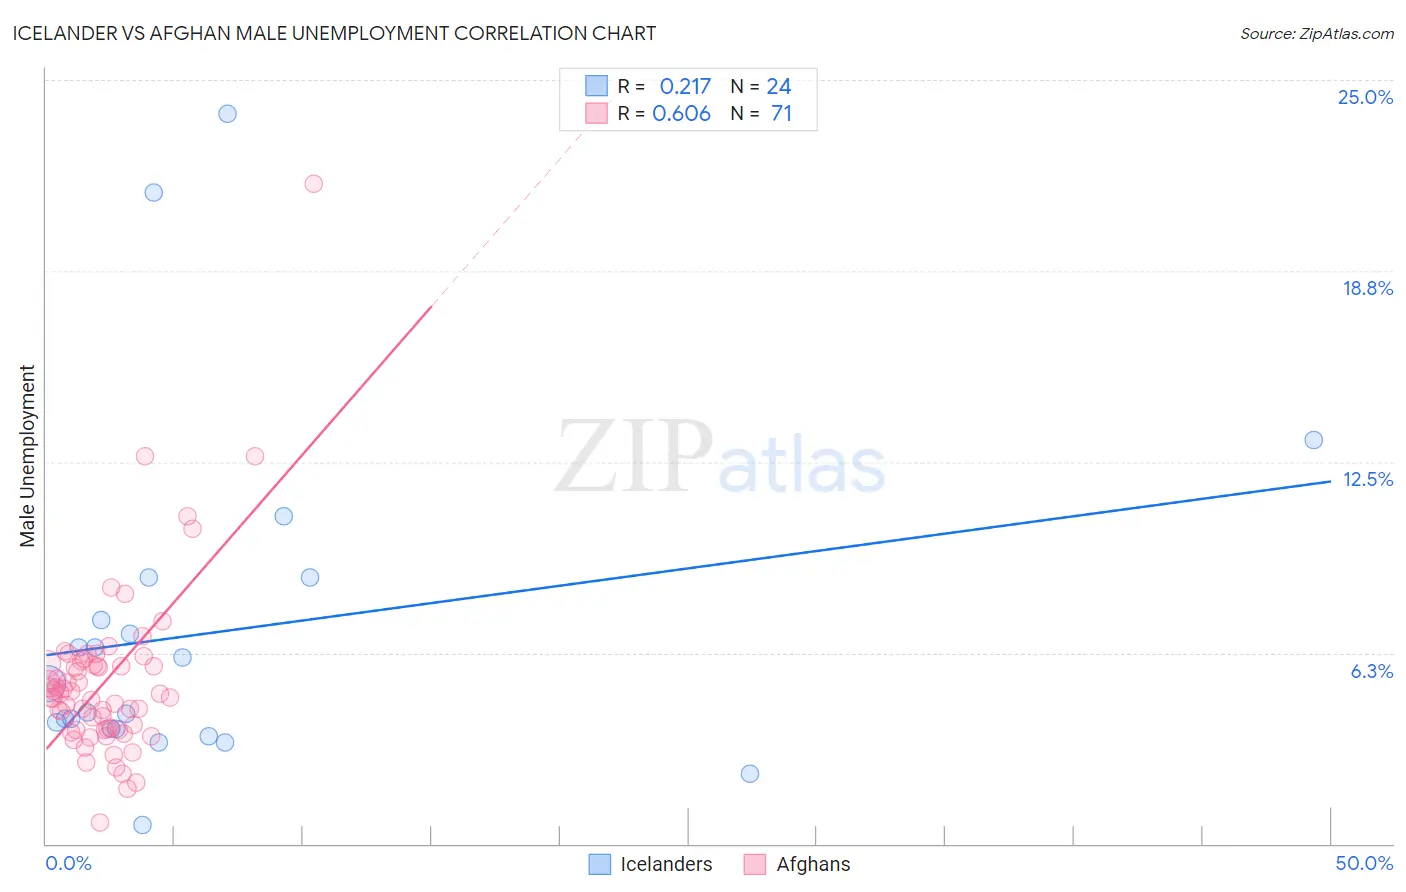
Icelander vs Afghan Male Unemployment Correlation Chart
The statistical analysis conducted on geographies consisting of 159,328,705 people shows a weak positive correlation between the proportion of Icelanders and unemployment rate among males in the United States with a correlation coefficient (R) of 0.217 and weighted average of 5.0%. Similarly, the statistical analysis conducted on geographies consisting of 148,819,810 people shows a significant positive correlation between the proportion of Afghans and unemployment rate among males in the United States with a correlation coefficient (R) of 0.606 and weighted average of 5.3%, a difference of 5.0%.
Male Unemployment Correlation Summary
| Measurement | Icelander | Afghan |
| Minimum | 0.60% | 0.70% |
| Maximum | 23.9% | 21.6% |
| Range | 23.3% | 20.9% |
| Mean | 6.9% | 5.3% |
| Median | 4.8% | 4.9% |
| Interquartile 25% (IQ1) | 3.7% | 3.7% |
| Interquartile 75% (IQ3) | 8.0% | 5.9% |
| Interquartile Range (IQR) | 4.3% | 2.1% |
| Standard Deviation (Sample) | 5.6% | 2.9% |
| Standard Deviation (Population) | 5.5% | 2.9% |
Similar Demographics by Male Unemployment
Demographics Similar to Icelanders by Male Unemployment
In terms of male unemployment, the demographic groups most similar to Icelanders are Finnish (5.0%, a difference of 0.090%), Immigrants from Canada (5.0%, a difference of 0.11%), Australian (5.0%, a difference of 0.12%), Immigrants from Sweden (5.0%, a difference of 0.15%), and Celtic (5.0%, a difference of 0.16%).
| Demographics | Rating | Rank | Male Unemployment |
| Lithuanians | 98.5 /100 | #58 | Exceptional 5.0% |
| Immigrants | Netherlands | 98.3 /100 | #59 | Exceptional 5.0% |
| Immigrants | Argentina | 98.1 /100 | #60 | Exceptional 5.0% |
| Cambodians | 98.1 /100 | #61 | Exceptional 5.0% |
| Basques | 97.9 /100 | #62 | Exceptional 5.0% |
| Eastern Europeans | 97.9 /100 | #63 | Exceptional 5.0% |
| Celtics | 97.8 /100 | #64 | Exceptional 5.0% |
| Icelanders | 97.6 /100 | #65 | Exceptional 5.0% |
| Finns | 97.5 /100 | #66 | Exceptional 5.0% |
| Immigrants | Canada | 97.5 /100 | #67 | Exceptional 5.0% |
| Australians | 97.4 /100 | #68 | Exceptional 5.0% |
| Immigrants | Sweden | 97.4 /100 | #69 | Exceptional 5.0% |
| Whites/Caucasians | 97.3 /100 | #70 | Exceptional 5.0% |
| New Zealanders | 97.3 /100 | #71 | Exceptional 5.0% |
| Immigrants | South Africa | 97.1 /100 | #72 | Exceptional 5.0% |
Demographics Similar to Afghans by Male Unemployment
In terms of male unemployment, the demographic groups most similar to Afghans are South American (5.3%, a difference of 0.080%), Immigrants from Morocco (5.3%, a difference of 0.11%), Immigrants from Vietnam (5.3%, a difference of 0.23%), Immigrants from Hong Kong (5.2%, a difference of 0.24%), and Immigrants from Egypt (5.2%, a difference of 0.25%).
| Demographics | Rating | Rank | Male Unemployment |
| Immigrants | Northern Africa | 72.3 /100 | #157 | Good 5.2% |
| Immigrants | Indonesia | 71.5 /100 | #158 | Good 5.2% |
| Indonesians | 71.2 /100 | #159 | Good 5.2% |
| Immigrants | Norway | 71.0 /100 | #160 | Good 5.2% |
| Immigrants | China | 70.6 /100 | #161 | Good 5.2% |
| Immigrants | Egypt | 65.9 /100 | #162 | Good 5.2% |
| Immigrants | Hong Kong | 65.7 /100 | #163 | Good 5.2% |
| Afghans | 62.0 /100 | #164 | Good 5.3% |
| South Americans | 60.6 /100 | #165 | Good 5.3% |
| Immigrants | Morocco | 60.2 /100 | #166 | Good 5.3% |
| Immigrants | Vietnam | 58.1 /100 | #167 | Average 5.3% |
| Immigrants | Ireland | 57.7 /100 | #168 | Average 5.3% |
| Immigrants | Congo | 57.4 /100 | #169 | Average 5.3% |
| Immigrants | Eastern Europe | 54.1 /100 | #170 | Average 5.3% |
| Peruvians | 51.9 /100 | #171 | Average 5.3% |