Immigrants from Colombia vs Afghan Male Unemployment
COMPARE
Immigrants from Colombia
Afghan
Male Unemployment
Male Unemployment Comparison
Immigrants from Colombia
Afghans
5.1%
MALE UNEMPLOYMENT
86.8/ 100
METRIC RATING
126th/ 347
METRIC RANK
5.3%
MALE UNEMPLOYMENT
62.0/ 100
METRIC RATING
164th/ 347
METRIC RANK
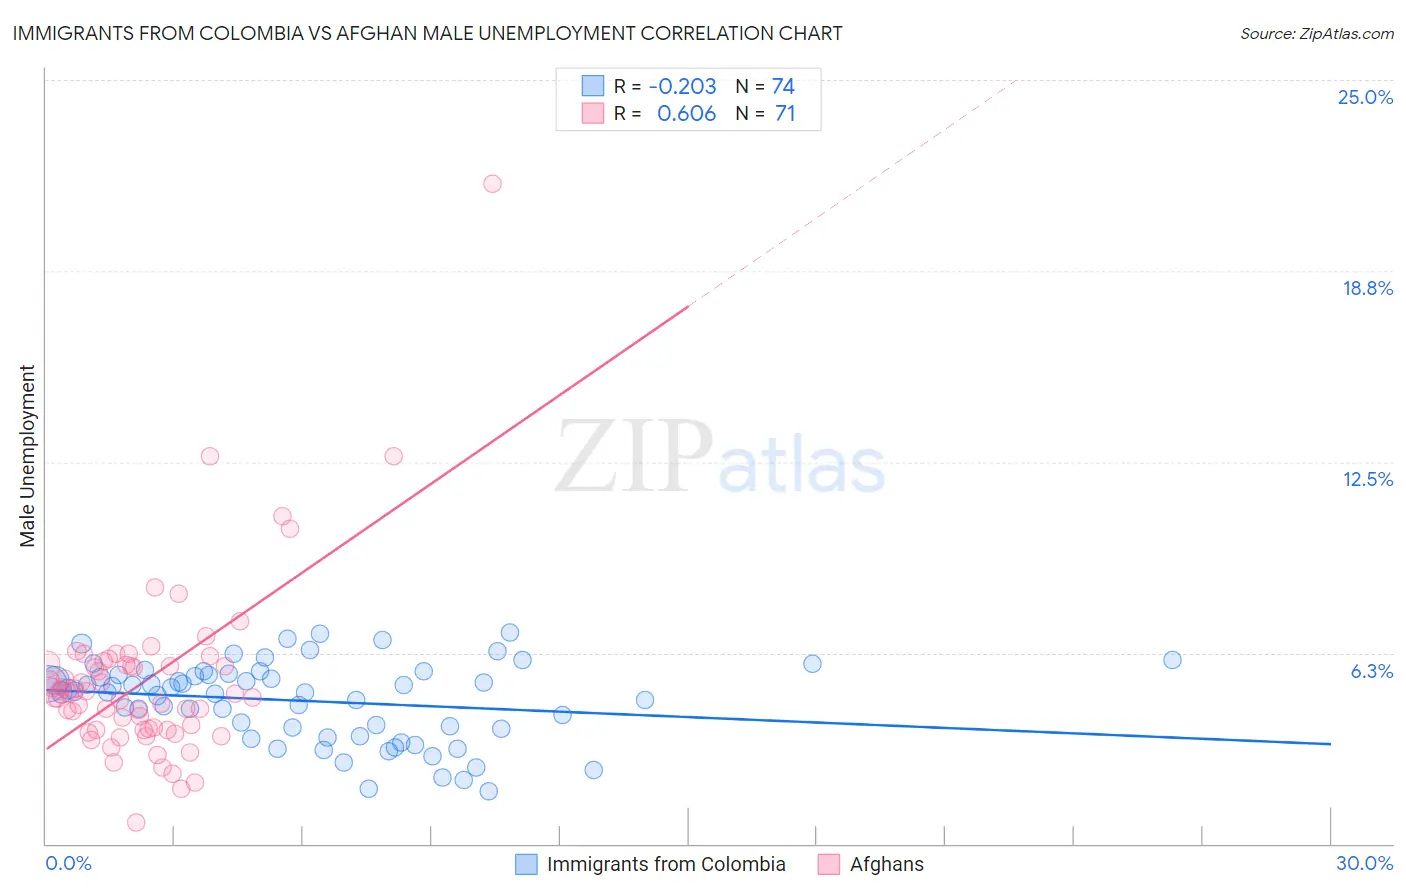
Immigrants from Colombia vs Afghan Male Unemployment Correlation Chart
The statistical analysis conducted on geographies consisting of 377,439,396 people shows a weak negative correlation between the proportion of Immigrants from Colombia and unemployment rate among males in the United States with a correlation coefficient (R) of -0.203 and weighted average of 5.1%. Similarly, the statistical analysis conducted on geographies consisting of 148,819,810 people shows a significant positive correlation between the proportion of Afghans and unemployment rate among males in the United States with a correlation coefficient (R) of 0.606 and weighted average of 5.3%, a difference of 2.1%.
Male Unemployment Correlation Summary
| Measurement | Immigrants from Colombia | Afghan |
| Minimum | 1.7% | 0.70% |
| Maximum | 6.9% | 21.6% |
| Range | 5.2% | 20.9% |
| Mean | 4.7% | 5.3% |
| Median | 5.0% | 4.9% |
| Interquartile 25% (IQ1) | 3.8% | 3.7% |
| Interquartile 75% (IQ3) | 5.5% | 5.9% |
| Interquartile Range (IQR) | 1.8% | 2.1% |
| Standard Deviation (Sample) | 1.3% | 2.9% |
| Standard Deviation (Population) | 1.3% | 2.9% |
Similar Demographics by Male Unemployment
Demographics Similar to Immigrants from Colombia by Male Unemployment
In terms of male unemployment, the demographic groups most similar to Immigrants from Colombia are Immigrants from Lithuania (5.1%, a difference of 0.060%), Immigrants from Brazil (5.2%, a difference of 0.060%), Immigrants from Latvia (5.1%, a difference of 0.10%), Palestinian (5.1%, a difference of 0.12%), and Nicaraguan (5.1%, a difference of 0.19%).
| Demographics | Rating | Rank | Male Unemployment |
| French Canadians | 88.6 /100 | #119 | Excellent 5.1% |
| Ukrainians | 88.4 /100 | #120 | Excellent 5.1% |
| Mongolians | 88.4 /100 | #121 | Excellent 5.1% |
| Nicaraguans | 88.2 /100 | #122 | Excellent 5.1% |
| Palestinians | 87.7 /100 | #123 | Excellent 5.1% |
| Immigrants | Latvia | 87.5 /100 | #124 | Excellent 5.1% |
| Immigrants | Lithuania | 87.2 /100 | #125 | Excellent 5.1% |
| Immigrants | Colombia | 86.8 /100 | #126 | Excellent 5.1% |
| Immigrants | Brazil | 86.3 /100 | #127 | Excellent 5.2% |
| Hungarians | 85.1 /100 | #128 | Excellent 5.2% |
| Immigrants | Western Europe | 84.8 /100 | #129 | Excellent 5.2% |
| Immigrants | Malaysia | 83.5 /100 | #130 | Excellent 5.2% |
| Immigrants | Germany | 83.0 /100 | #131 | Excellent 5.2% |
| Chickasaw | 82.9 /100 | #132 | Excellent 5.2% |
| Colombians | 81.1 /100 | #133 | Excellent 5.2% |
Demographics Similar to Afghans by Male Unemployment
In terms of male unemployment, the demographic groups most similar to Afghans are South American (5.3%, a difference of 0.080%), Immigrants from Morocco (5.3%, a difference of 0.11%), Immigrants from Vietnam (5.3%, a difference of 0.23%), Immigrants from Hong Kong (5.2%, a difference of 0.24%), and Immigrants from Egypt (5.2%, a difference of 0.25%).
| Demographics | Rating | Rank | Male Unemployment |
| Immigrants | Northern Africa | 72.3 /100 | #157 | Good 5.2% |
| Immigrants | Indonesia | 71.5 /100 | #158 | Good 5.2% |
| Indonesians | 71.2 /100 | #159 | Good 5.2% |
| Immigrants | Norway | 71.0 /100 | #160 | Good 5.2% |
| Immigrants | China | 70.6 /100 | #161 | Good 5.2% |
| Immigrants | Egypt | 65.9 /100 | #162 | Good 5.2% |
| Immigrants | Hong Kong | 65.7 /100 | #163 | Good 5.2% |
| Afghans | 62.0 /100 | #164 | Good 5.3% |
| South Americans | 60.6 /100 | #165 | Good 5.3% |
| Immigrants | Morocco | 60.2 /100 | #166 | Good 5.3% |
| Immigrants | Vietnam | 58.1 /100 | #167 | Average 5.3% |
| Immigrants | Ireland | 57.7 /100 | #168 | Average 5.3% |
| Immigrants | Congo | 57.4 /100 | #169 | Average 5.3% |
| Immigrants | Eastern Europe | 54.1 /100 | #170 | Average 5.3% |
| Peruvians | 51.9 /100 | #171 | Average 5.3% |