Immigrants from Romania vs Nigerian Female Unemployment
COMPARE
Immigrants from Romania
Nigerian
Female Unemployment
Female Unemployment Comparison
Immigrants from Romania
Nigerians
5.1%
FEMALE UNEMPLOYMENT
88.1/ 100
METRIC RATING
120th/ 347
METRIC RANK
5.8%
FEMALE UNEMPLOYMENT
0.2/ 100
METRIC RATING
260th/ 347
METRIC RANK
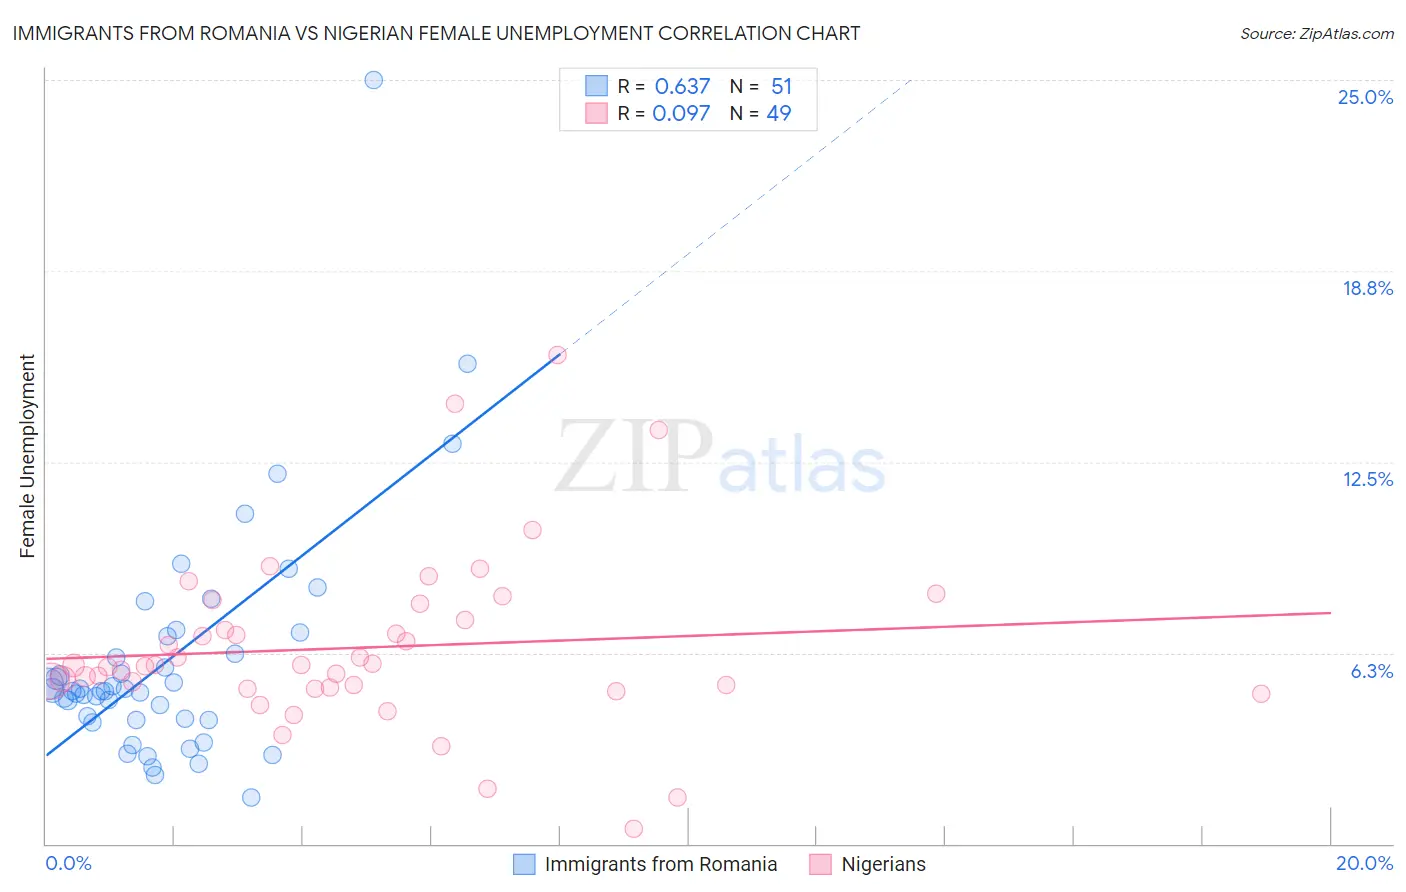
Immigrants from Romania vs Nigerian Female Unemployment Correlation Chart
The statistical analysis conducted on geographies consisting of 256,484,740 people shows a significant positive correlation between the proportion of Immigrants from Romania and unemploymnet rate among females in the United States with a correlation coefficient (R) of 0.637 and weighted average of 5.1%. Similarly, the statistical analysis conducted on geographies consisting of 332,062,717 people shows a slight positive correlation between the proportion of Nigerians and unemploymnet rate among females in the United States with a correlation coefficient (R) of 0.097 and weighted average of 5.8%, a difference of 13.0%.
Female Unemployment Correlation Summary
| Measurement | Immigrants from Romania | Nigerian |
| Minimum | 1.5% | 0.50% |
| Maximum | 25.0% | 16.0% |
| Range | 23.5% | 15.5% |
| Mean | 6.0% | 6.4% |
| Median | 5.0% | 5.8% |
| Interquartile 25% (IQ1) | 4.0% | 5.1% |
| Interquartile 75% (IQ3) | 6.8% | 7.6% |
| Interquartile Range (IQR) | 2.7% | 2.5% |
| Standard Deviation (Sample) | 3.9% | 2.9% |
| Standard Deviation (Population) | 3.8% | 2.8% |
Similar Demographics by Female Unemployment
Demographics Similar to Immigrants from Romania by Female Unemployment
In terms of female unemployment, the demographic groups most similar to Immigrants from Romania are Immigrants from Western Europe (5.1%, a difference of 0.0%), Immigrants from North Macedonia (5.1%, a difference of 0.020%), Immigrants from Germany (5.1%, a difference of 0.080%), Immigrants from South Africa (5.1%, a difference of 0.080%), and Immigrants from Europe (5.1%, a difference of 0.13%).
| Demographics | Rating | Rank | Female Unemployment |
| Immigrants | Saudi Arabia | 91.2 /100 | #113 | Exceptional 5.1% |
| Immigrants | Turkey | 91.0 /100 | #114 | Exceptional 5.1% |
| Lebanese | 91.0 /100 | #115 | Exceptional 5.1% |
| Americans | 90.5 /100 | #116 | Exceptional 5.1% |
| Jordanians | 90.3 /100 | #117 | Exceptional 5.1% |
| Immigrants | Croatia | 89.9 /100 | #118 | Excellent 5.1% |
| Immigrants | North Macedonia | 88.3 /100 | #119 | Excellent 5.1% |
| Immigrants | Romania | 88.1 /100 | #120 | Excellent 5.1% |
| Immigrants | Western Europe | 88.1 /100 | #121 | Excellent 5.1% |
| Immigrants | Germany | 87.6 /100 | #122 | Excellent 5.1% |
| Immigrants | South Africa | 87.6 /100 | #123 | Excellent 5.1% |
| Immigrants | Europe | 87.2 /100 | #124 | Excellent 5.1% |
| Basques | 86.5 /100 | #125 | Excellent 5.1% |
| Immigrants | Korea | 86.3 /100 | #126 | Excellent 5.1% |
| Immigrants | Hungary | 86.0 /100 | #127 | Excellent 5.1% |
Demographics Similar to Nigerians by Female Unemployment
In terms of female unemployment, the demographic groups most similar to Nigerians are Immigrants from Fiji (5.8%, a difference of 0.040%), Immigrants from Portugal (5.8%, a difference of 0.14%), Kiowa (5.8%, a difference of 0.26%), Immigrants from Nigeria (5.8%, a difference of 0.30%), and Dutch West Indian (5.7%, a difference of 0.95%).
| Demographics | Rating | Rank | Female Unemployment |
| Immigrants | Sierra Leone | 0.6 /100 | #253 | Tragic 5.7% |
| Immigrants | Immigrants | 0.6 /100 | #254 | Tragic 5.7% |
| Immigrants | Cameroon | 0.6 /100 | #255 | Tragic 5.7% |
| Sub-Saharan Africans | 0.4 /100 | #256 | Tragic 5.7% |
| Dutch West Indians | 0.3 /100 | #257 | Tragic 5.7% |
| Immigrants | Portugal | 0.2 /100 | #258 | Tragic 5.8% |
| Immigrants | Fiji | 0.2 /100 | #259 | Tragic 5.8% |
| Nigerians | 0.2 /100 | #260 | Tragic 5.8% |
| Kiowa | 0.1 /100 | #261 | Tragic 5.8% |
| Immigrants | Nigeria | 0.1 /100 | #262 | Tragic 5.8% |
| Immigrants | Azores | 0.1 /100 | #263 | Tragic 5.8% |
| Immigrants | Bahamas | 0.1 /100 | #264 | Tragic 5.8% |
| Blackfeet | 0.0 /100 | #265 | Tragic 5.9% |
| Cape Verdeans | 0.0 /100 | #266 | Tragic 5.9% |
| Nepalese | 0.0 /100 | #267 | Tragic 5.9% |