Immigrants from Bolivia vs Nigerian Female Unemployment
COMPARE
Immigrants from Bolivia
Nigerian
Female Unemployment
Female Unemployment Comparison
Immigrants from Bolivia
Nigerians
5.0%
FEMALE UNEMPLOYMENT
98.0/ 100
METRIC RATING
74th/ 347
METRIC RANK
5.8%
FEMALE UNEMPLOYMENT
0.2/ 100
METRIC RATING
260th/ 347
METRIC RANK
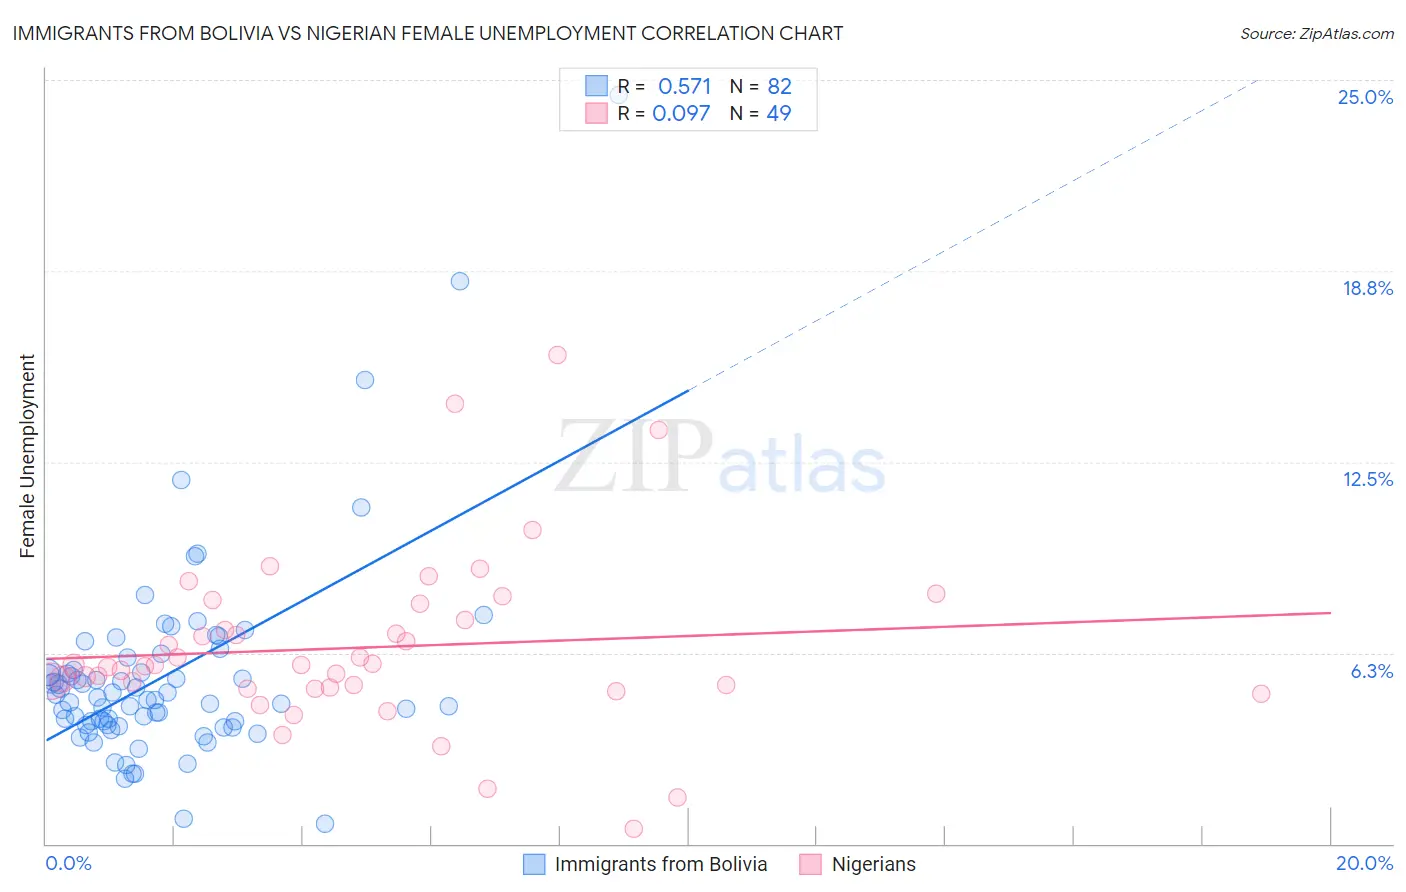
Immigrants from Bolivia vs Nigerian Female Unemployment Correlation Chart
The statistical analysis conducted on geographies consisting of 158,575,090 people shows a substantial positive correlation between the proportion of Immigrants from Bolivia and unemploymnet rate among females in the United States with a correlation coefficient (R) of 0.571 and weighted average of 5.0%. Similarly, the statistical analysis conducted on geographies consisting of 332,062,717 people shows a slight positive correlation between the proportion of Nigerians and unemploymnet rate among females in the United States with a correlation coefficient (R) of 0.097 and weighted average of 5.8%, a difference of 16.3%.
Female Unemployment Correlation Summary
| Measurement | Immigrants from Bolivia | Nigerian |
| Minimum | 0.67% | 0.50% |
| Maximum | 24.5% | 16.0% |
| Range | 23.8% | 15.5% |
| Mean | 5.5% | 6.4% |
| Median | 4.8% | 5.8% |
| Interquartile 25% (IQ1) | 3.9% | 5.1% |
| Interquartile 75% (IQ3) | 5.7% | 7.6% |
| Interquartile Range (IQR) | 1.8% | 2.5% |
| Standard Deviation (Sample) | 3.4% | 2.9% |
| Standard Deviation (Population) | 3.4% | 2.8% |
Similar Demographics by Female Unemployment
Demographics Similar to Immigrants from Bolivia by Female Unemployment
In terms of female unemployment, the demographic groups most similar to Immigrants from Bolivia are Russian (5.0%, a difference of 0.010%), Immigrants from Singapore (5.0%, a difference of 0.020%), Immigrants from Venezuela (5.0%, a difference of 0.030%), Immigrants from Northern Europe (4.9%, a difference of 0.040%), and German Russian (4.9%, a difference of 0.11%).
| Demographics | Rating | Rank | Female Unemployment |
| Cubans | 98.3 /100 | #67 | Exceptional 4.9% |
| Tlingit-Haida | 98.3 /100 | #68 | Exceptional 4.9% |
| Immigrants | Ireland | 98.2 /100 | #69 | Exceptional 4.9% |
| Osage | 98.2 /100 | #70 | Exceptional 4.9% |
| German Russians | 98.1 /100 | #71 | Exceptional 4.9% |
| Immigrants | Northern Europe | 98.0 /100 | #72 | Exceptional 4.9% |
| Russians | 98.0 /100 | #73 | Exceptional 5.0% |
| Immigrants | Bolivia | 98.0 /100 | #74 | Exceptional 5.0% |
| Immigrants | Singapore | 98.0 /100 | #75 | Exceptional 5.0% |
| Immigrants | Venezuela | 97.9 /100 | #76 | Exceptional 5.0% |
| Mongolians | 97.8 /100 | #77 | Exceptional 5.0% |
| Immigrants | Netherlands | 97.8 /100 | #78 | Exceptional 5.0% |
| Turks | 97.6 /100 | #79 | Exceptional 5.0% |
| New Zealanders | 97.4 /100 | #80 | Exceptional 5.0% |
| Filipinos | 97.3 /100 | #81 | Exceptional 5.0% |
Demographics Similar to Nigerians by Female Unemployment
In terms of female unemployment, the demographic groups most similar to Nigerians are Immigrants from Fiji (5.8%, a difference of 0.040%), Immigrants from Portugal (5.8%, a difference of 0.14%), Kiowa (5.8%, a difference of 0.26%), Immigrants from Nigeria (5.8%, a difference of 0.30%), and Dutch West Indian (5.7%, a difference of 0.95%).
| Demographics | Rating | Rank | Female Unemployment |
| Immigrants | Sierra Leone | 0.6 /100 | #253 | Tragic 5.7% |
| Immigrants | Immigrants | 0.6 /100 | #254 | Tragic 5.7% |
| Immigrants | Cameroon | 0.6 /100 | #255 | Tragic 5.7% |
| Sub-Saharan Africans | 0.4 /100 | #256 | Tragic 5.7% |
| Dutch West Indians | 0.3 /100 | #257 | Tragic 5.7% |
| Immigrants | Portugal | 0.2 /100 | #258 | Tragic 5.8% |
| Immigrants | Fiji | 0.2 /100 | #259 | Tragic 5.8% |
| Nigerians | 0.2 /100 | #260 | Tragic 5.8% |
| Kiowa | 0.1 /100 | #261 | Tragic 5.8% |
| Immigrants | Nigeria | 0.1 /100 | #262 | Tragic 5.8% |
| Immigrants | Azores | 0.1 /100 | #263 | Tragic 5.8% |
| Immigrants | Bahamas | 0.1 /100 | #264 | Tragic 5.8% |
| Blackfeet | 0.0 /100 | #265 | Tragic 5.9% |
| Cape Verdeans | 0.0 /100 | #266 | Tragic 5.9% |
| Nepalese | 0.0 /100 | #267 | Tragic 5.9% |