Soviet Union vs Immigrants from Eastern Asia 3rd Grade
COMPARE
Soviet Union
Immigrants from Eastern Asia
3rd Grade
3rd Grade Comparison
Soviet Union
Immigrants from Eastern Asia
97.8%
3RD GRADE
72.6/ 100
METRIC RATING
151st/ 347
METRIC RANK
97.4%
3RD GRADE
1.9/ 100
METRIC RATING
234th/ 347
METRIC RANK
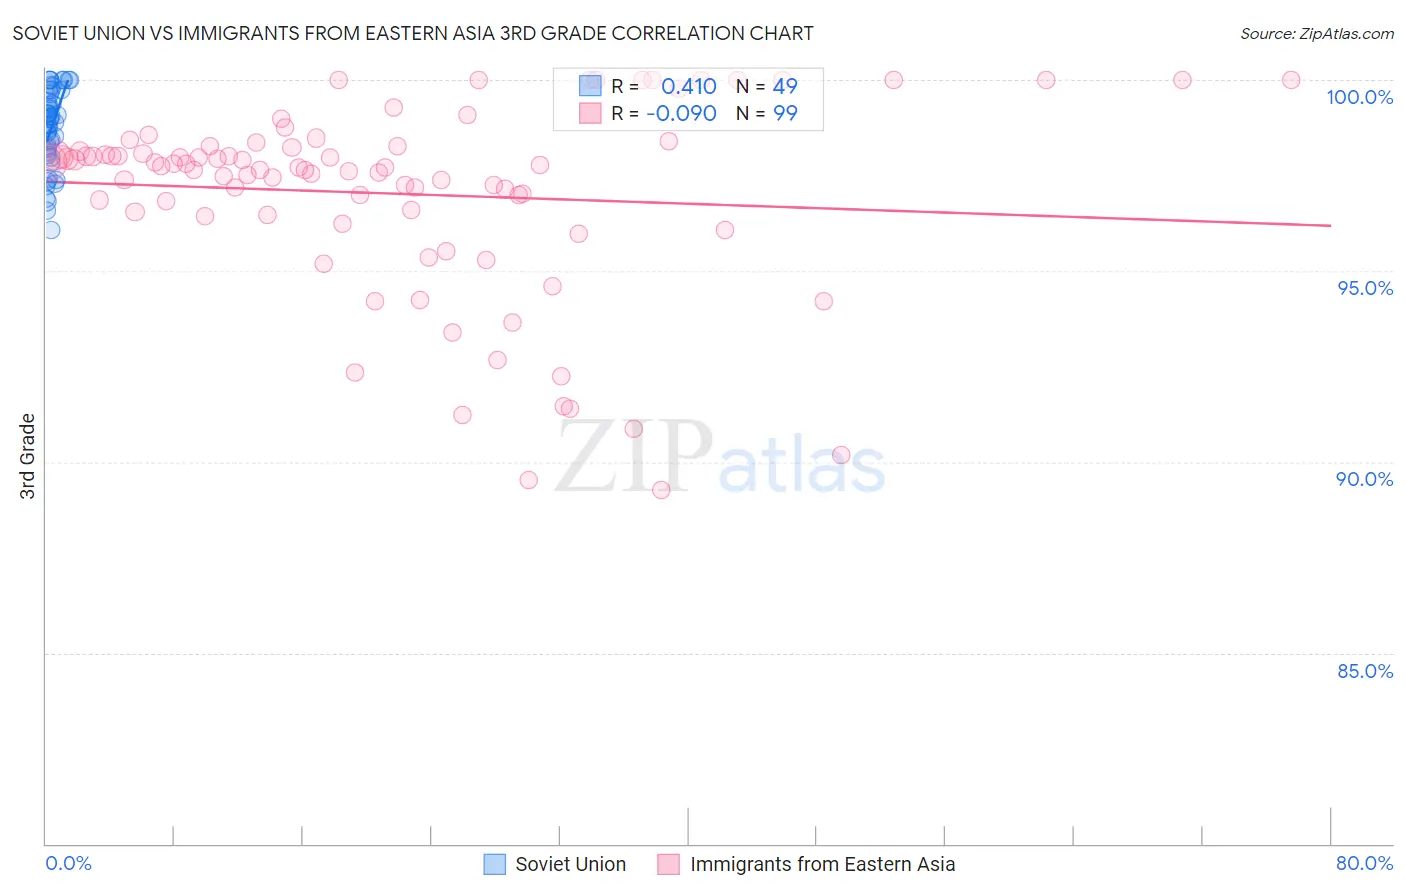
Soviet Union vs Immigrants from Eastern Asia 3rd Grade Correlation Chart
The statistical analysis conducted on geographies consisting of 43,454,395 people shows a moderate positive correlation between the proportion of Soviet Union and percentage of population with at least 3rd grade education in the United States with a correlation coefficient (R) of 0.410 and weighted average of 97.8%. Similarly, the statistical analysis conducted on geographies consisting of 499,865,893 people shows a slight negative correlation between the proportion of Immigrants from Eastern Asia and percentage of population with at least 3rd grade education in the United States with a correlation coefficient (R) of -0.090 and weighted average of 97.4%, a difference of 0.42%.
3rd Grade Correlation Summary
| Measurement | Soviet Union | Immigrants from Eastern Asia |
| Minimum | 96.1% | 89.3% |
| Maximum | 100.0% | 100.0% |
| Range | 3.9% | 10.7% |
| Mean | 98.7% | 97.0% |
| Median | 99.0% | 97.7% |
| Interquartile 25% (IQ1) | 98.1% | 96.5% |
| Interquartile 75% (IQ3) | 99.7% | 98.3% |
| Interquartile Range (IQR) | 1.6% | 1.8% |
| Standard Deviation (Sample) | 1.0% | 2.5% |
| Standard Deviation (Population) | 1.0% | 2.5% |
Similar Demographics by 3rd Grade
Demographics Similar to Soviet Union by 3rd Grade
In terms of 3rd grade, the demographic groups most similar to Soviet Union are Immigrants from North Macedonia (97.8%, a difference of 0.010%), Jordanian (97.8%, a difference of 0.010%), Immigrants from South Central Asia (97.8%, a difference of 0.010%), Immigrants from Israel (97.9%, a difference of 0.020%), and Immigrants from Moldova (97.9%, a difference of 0.020%).
| Demographics | Rating | Rank | 3rd Grade |
| Burmese | 79.6 /100 | #144 | Good 97.9% |
| Immigrants | Greece | 79.5 /100 | #145 | Good 97.9% |
| Alsatians | 78.3 /100 | #146 | Good 97.9% |
| Immigrants | Israel | 77.3 /100 | #147 | Good 97.9% |
| Immigrants | Moldova | 77.1 /100 | #148 | Good 97.9% |
| Immigrants | North Macedonia | 74.5 /100 | #149 | Good 97.8% |
| Jordanians | 74.5 /100 | #150 | Good 97.8% |
| Soviet Union | 72.6 /100 | #151 | Good 97.8% |
| Immigrants | South Central Asia | 69.5 /100 | #152 | Good 97.8% |
| Apache | 68.5 /100 | #153 | Good 97.8% |
| Immigrants | Eastern Europe | 64.1 /100 | #154 | Good 97.8% |
| Bermudans | 62.6 /100 | #155 | Good 97.8% |
| Immigrants | Russia | 61.7 /100 | #156 | Good 97.8% |
| Immigrants | Italy | 61.2 /100 | #157 | Good 97.8% |
| Venezuelans | 60.9 /100 | #158 | Good 97.8% |
Demographics Similar to Immigrants from Eastern Asia by 3rd Grade
In terms of 3rd grade, the demographic groups most similar to Immigrants from Eastern Asia are Immigrants from Iraq (97.4%, a difference of 0.010%), Liberian (97.4%, a difference of 0.010%), Colombian (97.4%, a difference of 0.010%), Immigrants from Uruguay (97.4%, a difference of 0.010%), and Immigrants from Western Asia (97.5%, a difference of 0.020%).
| Demographics | Rating | Rank | 3rd Grade |
| Immigrants | Sudan | 3.4 /100 | #227 | Tragic 97.5% |
| Sub-Saharan Africans | 3.2 /100 | #228 | Tragic 97.5% |
| Senegalese | 3.0 /100 | #229 | Tragic 97.5% |
| Immigrants | Pakistan | 2.7 /100 | #230 | Tragic 97.5% |
| Immigrants | Costa Rica | 2.7 /100 | #231 | Tragic 97.5% |
| Immigrants | Western Asia | 2.6 /100 | #232 | Tragic 97.5% |
| Immigrants | Malaysia | 2.4 /100 | #233 | Tragic 97.5% |
| Immigrants | Eastern Asia | 1.9 /100 | #234 | Tragic 97.4% |
| Immigrants | Iraq | 1.8 /100 | #235 | Tragic 97.4% |
| Liberians | 1.8 /100 | #236 | Tragic 97.4% |
| Colombians | 1.8 /100 | #237 | Tragic 97.4% |
| Immigrants | Uruguay | 1.7 /100 | #238 | Tragic 97.4% |
| Nigerians | 1.6 /100 | #239 | Tragic 97.4% |
| U.S. Virgin Islanders | 1.4 /100 | #240 | Tragic 97.4% |
| Immigrants | Indonesia | 1.4 /100 | #241 | Tragic 97.4% |