Immigrants from Uruguay vs Immigrants from Belize Female Unemployment
COMPARE
Immigrants from Uruguay
Immigrants from Belize
Female Unemployment
Female Unemployment Comparison
Immigrants from Uruguay
Immigrants from Belize
5.5%
FEMALE UNEMPLOYMENT
4.7/ 100
METRIC RATING
230th/ 347
METRIC RANK
6.5%
FEMALE UNEMPLOYMENT
0.0/ 100
METRIC RATING
323rd/ 347
METRIC RANK
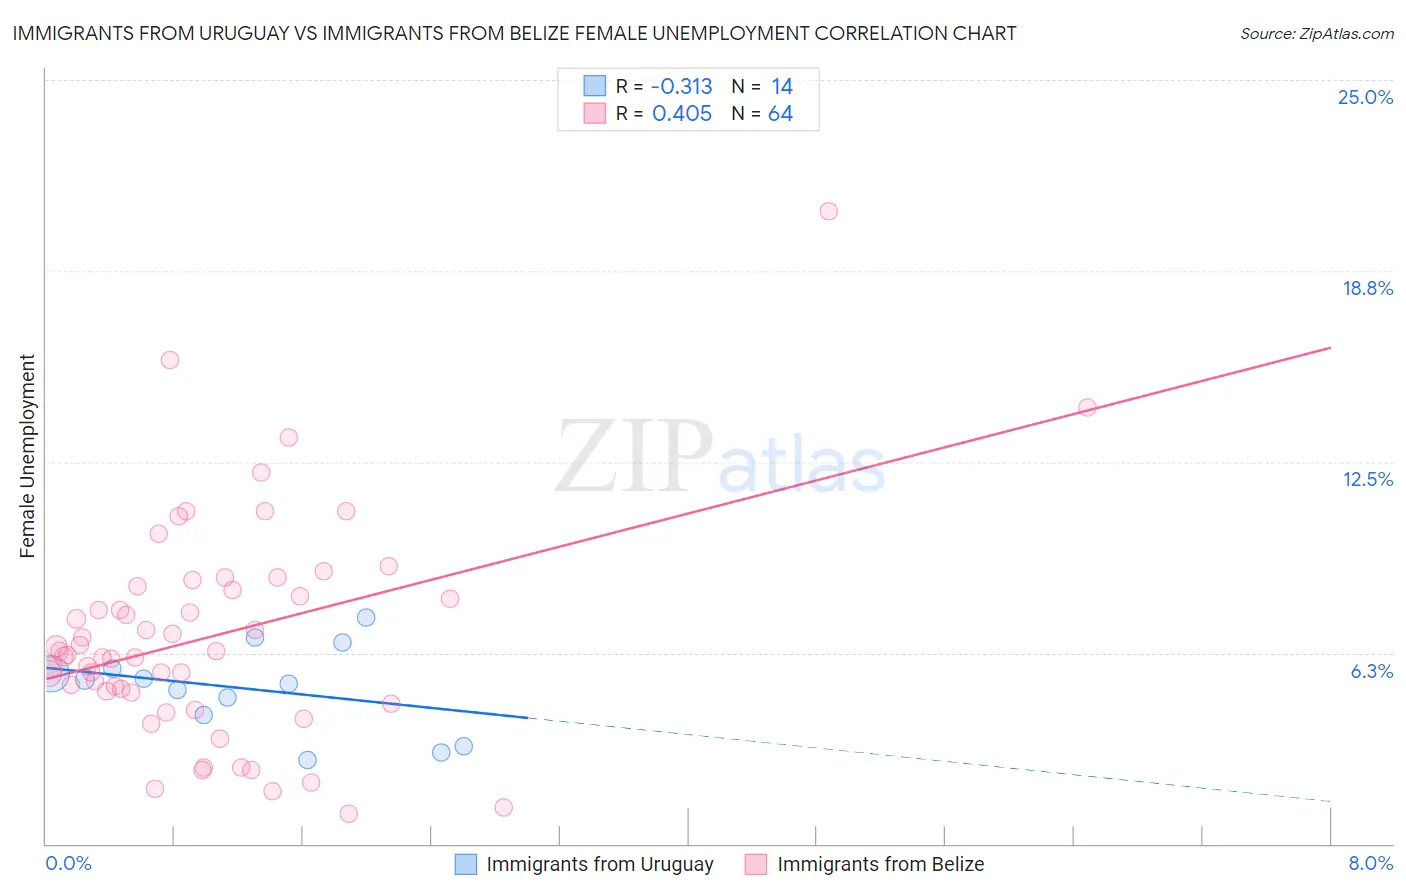
Immigrants from Uruguay vs Immigrants from Belize Female Unemployment Correlation Chart
The statistical analysis conducted on geographies consisting of 133,202,140 people shows a mild negative correlation between the proportion of Immigrants from Uruguay and unemploymnet rate among females in the United States with a correlation coefficient (R) of -0.313 and weighted average of 5.5%. Similarly, the statistical analysis conducted on geographies consisting of 130,161,278 people shows a moderate positive correlation between the proportion of Immigrants from Belize and unemploymnet rate among females in the United States with a correlation coefficient (R) of 0.405 and weighted average of 6.5%, a difference of 18.3%.
Female Unemployment Correlation Summary
| Measurement | Immigrants from Uruguay | Immigrants from Belize |
| Minimum | 2.8% | 1.0% |
| Maximum | 7.4% | 20.7% |
| Range | 4.6% | 19.7% |
| Mean | 5.1% | 6.8% |
| Median | 5.3% | 6.2% |
| Interquartile 25% (IQ1) | 4.2% | 5.0% |
| Interquartile 75% (IQ3) | 5.7% | 8.4% |
| Interquartile Range (IQR) | 1.5% | 3.4% |
| Standard Deviation (Sample) | 1.4% | 3.6% |
| Standard Deviation (Population) | 1.3% | 3.5% |
Similar Demographics by Female Unemployment
Demographics Similar to Immigrants from Uruguay by Female Unemployment
In terms of female unemployment, the demographic groups most similar to Immigrants from Uruguay are Panamanian (5.5%, a difference of 0.010%), Israeli (5.5%, a difference of 0.020%), Immigrants from Philippines (5.5%, a difference of 0.18%), Immigrants from Iraq (5.5%, a difference of 0.27%), and Liberian (5.5%, a difference of 0.28%).
| Demographics | Rating | Rank | Female Unemployment |
| Delaware | 7.2 /100 | #223 | Tragic 5.5% |
| Iraqis | 7.1 /100 | #224 | Tragic 5.5% |
| French American Indians | 6.1 /100 | #225 | Tragic 5.5% |
| Immigrants | Peru | 5.9 /100 | #226 | Tragic 5.5% |
| Immigrants | Philippines | 5.3 /100 | #227 | Tragic 5.5% |
| Israelis | 4.8 /100 | #228 | Tragic 5.5% |
| Panamanians | 4.7 /100 | #229 | Tragic 5.5% |
| Immigrants | Uruguay | 4.7 /100 | #230 | Tragic 5.5% |
| Immigrants | Iraq | 3.9 /100 | #231 | Tragic 5.5% |
| Liberians | 3.9 /100 | #232 | Tragic 5.5% |
| Moroccans | 3.4 /100 | #233 | Tragic 5.5% |
| Immigrants | Lebanon | 3.3 /100 | #234 | Tragic 5.5% |
| Immigrants | Iran | 3.3 /100 | #235 | Tragic 5.5% |
| Immigrants | Cambodia | 3.3 /100 | #236 | Tragic 5.5% |
| Immigrants | Panama | 3.2 /100 | #237 | Tragic 5.5% |
Demographics Similar to Immigrants from Belize by Female Unemployment
In terms of female unemployment, the demographic groups most similar to Immigrants from Belize are Vietnamese (6.5%, a difference of 0.10%), Black/African American (6.5%, a difference of 0.18%), Immigrants from Dominica (6.5%, a difference of 0.72%), Immigrants from Bangladesh (6.5%, a difference of 0.73%), and British West Indian (6.4%, a difference of 0.92%).
| Demographics | Rating | Rank | Female Unemployment |
| Houma | 0.0 /100 | #316 | Tragic 6.4% |
| Immigrants | St. Vincent and the Grenadines | 0.0 /100 | #317 | Tragic 6.4% |
| British West Indians | 0.0 /100 | #318 | Tragic 6.4% |
| Immigrants | Bangladesh | 0.0 /100 | #319 | Tragic 6.5% |
| Immigrants | Dominica | 0.0 /100 | #320 | Tragic 6.5% |
| Blacks/African Americans | 0.0 /100 | #321 | Tragic 6.5% |
| Vietnamese | 0.0 /100 | #322 | Tragic 6.5% |
| Immigrants | Belize | 0.0 /100 | #323 | Tragic 6.5% |
| Cheyenne | 0.0 /100 | #324 | Tragic 6.6% |
| Apache | 0.0 /100 | #325 | Tragic 6.6% |
| Natives/Alaskans | 0.0 /100 | #326 | Tragic 6.6% |
| Alaska Natives | 0.0 /100 | #327 | Tragic 6.6% |
| Guyanese | 0.0 /100 | #328 | Tragic 6.7% |
| Immigrants | Guyana | 0.0 /100 | #329 | Tragic 6.7% |
| Yakama | 0.0 /100 | #330 | Tragic 6.7% |