Soviet Union vs Immigrants from Belize Unemployment Among Seniors over 75 years
COMPARE
Soviet Union
Immigrants from Belize
Unemployment Among Seniors over 75 years
Unemployment Among Seniors over 75 years Comparison
Soviet Union
Immigrants from Belize
6.6%
UNEMPLOYMENT AMONG SENIORS OVER 75 YEARS
100.0/ 100
METRIC RATING
9th/ 347
METRIC RANK
8.7%
UNEMPLOYMENT AMONG SENIORS OVER 75 YEARS
57.6/ 100
METRIC RATING
166th/ 347
METRIC RANK
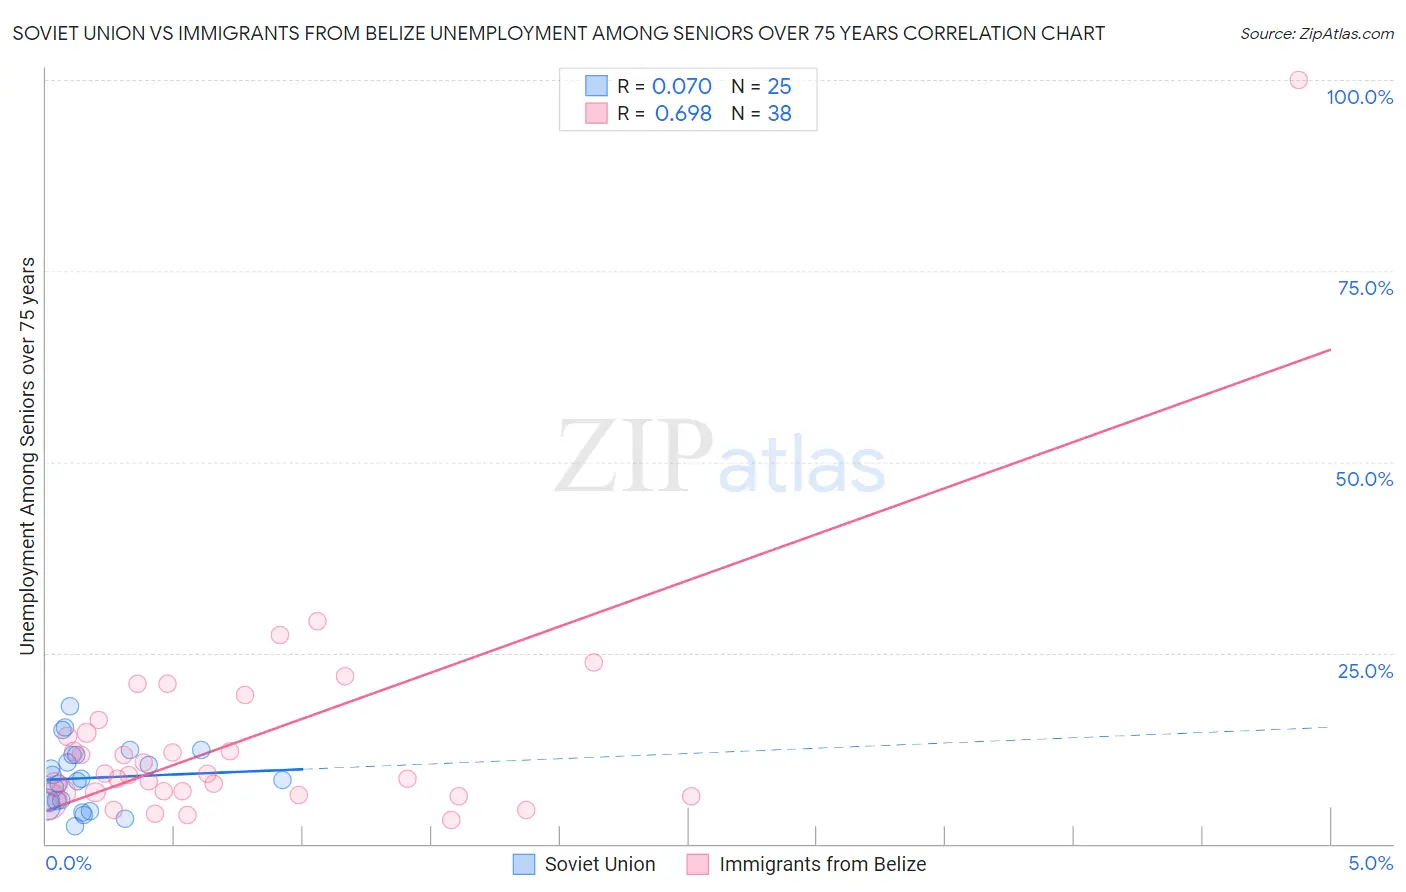
Soviet Union vs Immigrants from Belize Unemployment Among Seniors over 75 years Correlation Chart
The statistical analysis conducted on geographies consisting of 39,610,083 people shows a slight positive correlation between the proportion of Soviet Union and unemployment rate among seniors over the age of 75 in the United States with a correlation coefficient (R) of 0.070 and weighted average of 6.6%. Similarly, the statistical analysis conducted on geographies consisting of 92,317,800 people shows a significant positive correlation between the proportion of Immigrants from Belize and unemployment rate among seniors over the age of 75 in the United States with a correlation coefficient (R) of 0.698 and weighted average of 8.7%, a difference of 31.0%.
Unemployment Among Seniors over 75 years Correlation Summary
| Measurement | Soviet Union | Immigrants from Belize |
| Minimum | 2.2% | 3.1% |
| Maximum | 18.0% | 100.0% |
| Range | 15.8% | 96.9% |
| Mean | 8.6% | 13.6% |
| Median | 8.3% | 9.0% |
| Interquartile 25% (IQ1) | 5.2% | 6.8% |
| Interquartile 75% (IQ3) | 11.6% | 14.5% |
| Interquartile Range (IQR) | 6.3% | 7.8% |
| Standard Deviation (Sample) | 4.1% | 15.9% |
| Standard Deviation (Population) | 4.0% | 15.7% |
Similar Demographics by Unemployment Among Seniors over 75 years
Demographics Similar to Soviet Union by Unemployment Among Seniors over 75 years
In terms of unemployment among seniors over 75 years, the demographic groups most similar to Soviet Union are Yuman (6.7%, a difference of 0.22%), Immigrants from Grenada (6.7%, a difference of 0.31%), Comanche (6.7%, a difference of 0.45%), Immigrants from Congo (6.7%, a difference of 1.3%), and Taiwanese (6.6%, a difference of 1.3%).
| Demographics | Rating | Rank | Unemployment Among Seniors over 75 years |
| Chinese | 100.0 /100 | #2 | Exceptional 5.9% |
| Cheyenne | 100.0 /100 | #3 | Exceptional 5.9% |
| Alsatians | 100.0 /100 | #4 | Exceptional 6.1% |
| Hopi | 100.0 /100 | #5 | Exceptional 6.3% |
| Immigrants | Armenia | 100.0 /100 | #6 | Exceptional 6.5% |
| Spanish American Indians | 100.0 /100 | #7 | Exceptional 6.5% |
| Taiwanese | 100.0 /100 | #8 | Exceptional 6.6% |
| Soviet Union | 100.0 /100 | #9 | Exceptional 6.6% |
| Yuman | 100.0 /100 | #10 | Exceptional 6.7% |
| Immigrants | Grenada | 100.0 /100 | #11 | Exceptional 6.7% |
| Comanche | 100.0 /100 | #12 | Exceptional 6.7% |
| Immigrants | Congo | 100.0 /100 | #13 | Exceptional 6.7% |
| Ute | 100.0 /100 | #14 | Exceptional 6.8% |
| Icelanders | 100.0 /100 | #15 | Exceptional 7.0% |
| Seminole | 100.0 /100 | #16 | Exceptional 7.1% |
Demographics Similar to Immigrants from Belize by Unemployment Among Seniors over 75 years
In terms of unemployment among seniors over 75 years, the demographic groups most similar to Immigrants from Belize are Immigrants from Eastern Africa (8.7%, a difference of 0.0%), Immigrants from Lithuania (8.7%, a difference of 0.020%), Fijian (8.7%, a difference of 0.070%), Zimbabwean (8.7%, a difference of 0.19%), and Immigrants from Dominican Republic (8.7%, a difference of 0.21%).
| Demographics | Rating | Rank | Unemployment Among Seniors over 75 years |
| Shoshone | 74.6 /100 | #159 | Good 8.6% |
| Cree | 72.8 /100 | #160 | Good 8.6% |
| Albanians | 72.8 /100 | #161 | Good 8.6% |
| Immigrants | South America | 71.3 /100 | #162 | Good 8.6% |
| Immigrants | Guatemala | 68.4 /100 | #163 | Good 8.7% |
| Paraguayans | 62.2 /100 | #164 | Good 8.7% |
| Immigrants | Dominican Republic | 61.4 /100 | #165 | Good 8.7% |
| Immigrants | Belize | 57.6 /100 | #166 | Average 8.7% |
| Immigrants | Eastern Africa | 57.6 /100 | #167 | Average 8.7% |
| Immigrants | Lithuania | 57.2 /100 | #168 | Average 8.7% |
| Fijians | 56.4 /100 | #169 | Average 8.7% |
| Zimbabweans | 54.1 /100 | #170 | Average 8.7% |
| Dominicans | 51.9 /100 | #171 | Average 8.7% |
| Immigrants | Immigrants | 51.8 /100 | #172 | Average 8.7% |
| Australians | 50.3 /100 | #173 | Average 8.7% |