South American vs Immigrants from Romania Unemployment Among Women with Children Ages 6 to 17 years
COMPARE
South American
Immigrants from Romania
Unemployment Among Women with Children Ages 6 to 17 years
Unemployment Among Women with Children Ages 6 to 17 years Comparison
South Americans
Immigrants from Romania
9.5%
UNEMPLOYMENT AMONG WOMEN WITH CHILDREN AGES 6 TO 17 YEARS
0.5/ 100
METRIC RATING
261st/ 347
METRIC RANK
8.6%
UNEMPLOYMENT AMONG WOMEN WITH CHILDREN AGES 6 TO 17 YEARS
97.5/ 100
METRIC RATING
109th/ 347
METRIC RANK
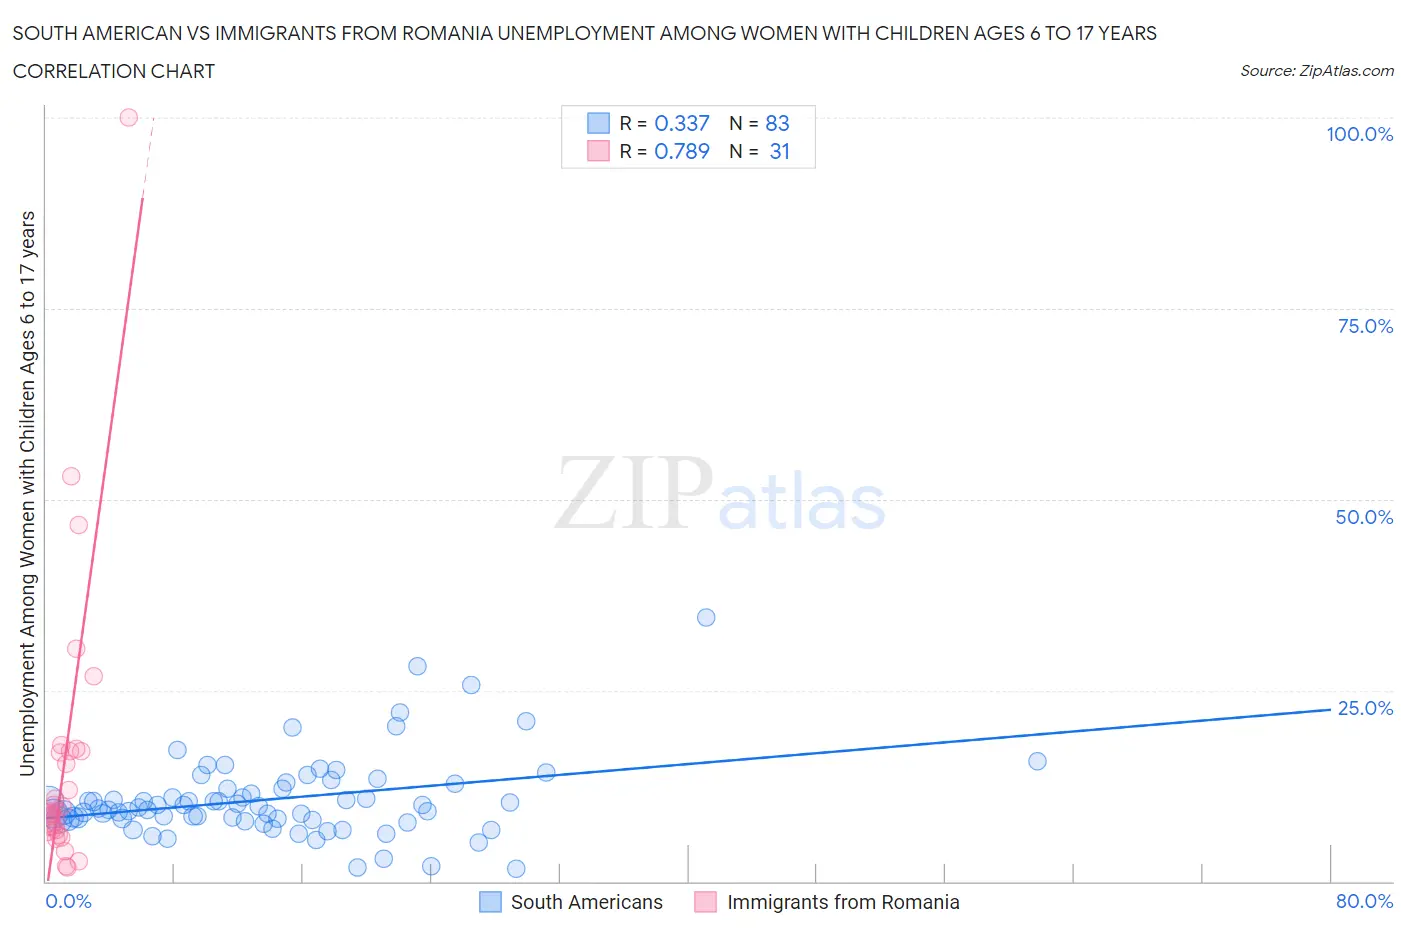
South American vs Immigrants from Romania Unemployment Among Women with Children Ages 6 to 17 years Correlation Chart
The statistical analysis conducted on geographies consisting of 336,338,597 people shows a mild positive correlation between the proportion of South Americans and unemployment rate among women with children between the ages 6 and 17 in the United States with a correlation coefficient (R) of 0.337 and weighted average of 9.5%. Similarly, the statistical analysis conducted on geographies consisting of 195,503,585 people shows a strong positive correlation between the proportion of Immigrants from Romania and unemployment rate among women with children between the ages 6 and 17 in the United States with a correlation coefficient (R) of 0.789 and weighted average of 8.6%, a difference of 10.3%.
Unemployment Among Women with Children Ages 6 to 17 years Correlation Summary
| Measurement | South American | Immigrants from Romania |
| Minimum | 1.6% | 1.9% |
| Maximum | 34.5% | 100.0% |
| Range | 32.9% | 98.1% |
| Mean | 10.7% | 16.2% |
| Median | 9.7% | 9.2% |
| Interquartile 25% (IQ1) | 8.1% | 6.7% |
| Interquartile 75% (IQ3) | 12.2% | 17.1% |
| Interquartile Range (IQR) | 4.1% | 10.4% |
| Standard Deviation (Sample) | 5.4% | 19.5% |
| Standard Deviation (Population) | 5.3% | 19.2% |
Similar Demographics by Unemployment Among Women with Children Ages 6 to 17 years
Demographics Similar to South Americans by Unemployment Among Women with Children Ages 6 to 17 years
In terms of unemployment among women with children ages 6 to 17 years, the demographic groups most similar to South Americans are Senegalese (9.5%, a difference of 0.050%), Italian (9.5%, a difference of 0.080%), Lebanese (9.5%, a difference of 0.090%), Immigrants from Central America (9.5%, a difference of 0.19%), and Immigrants from Mexico (9.5%, a difference of 0.29%).
| Demographics | Rating | Rank | Unemployment Among Women with Children Ages 6 to 17 years |
| Nicaraguans | 1.0 /100 | #254 | Tragic 9.4% |
| Lithuanians | 0.9 /100 | #255 | Tragic 9.4% |
| Canadians | 0.8 /100 | #256 | Tragic 9.4% |
| Celtics | 0.7 /100 | #257 | Tragic 9.5% |
| Immigrants | Mexico | 0.7 /100 | #258 | Tragic 9.5% |
| Immigrants | Central America | 0.6 /100 | #259 | Tragic 9.5% |
| Italians | 0.6 /100 | #260 | Tragic 9.5% |
| South Americans | 0.5 /100 | #261 | Tragic 9.5% |
| Senegalese | 0.5 /100 | #262 | Tragic 9.5% |
| Lebanese | 0.5 /100 | #263 | Tragic 9.5% |
| Immigrants | Ghana | 0.4 /100 | #264 | Tragic 9.5% |
| West Indians | 0.4 /100 | #265 | Tragic 9.5% |
| Immigrants | Jamaica | 0.3 /100 | #266 | Tragic 9.5% |
| Irish | 0.3 /100 | #267 | Tragic 9.5% |
| Ghanaians | 0.2 /100 | #268 | Tragic 9.6% |
Demographics Similar to Immigrants from Romania by Unemployment Among Women with Children Ages 6 to 17 years
In terms of unemployment among women with children ages 6 to 17 years, the demographic groups most similar to Immigrants from Romania are Latvian (8.6%, a difference of 0.010%), Immigrants from Ukraine (8.6%, a difference of 0.020%), Swedish (8.6%, a difference of 0.070%), Chickasaw (8.6%, a difference of 0.080%), and Immigrants from Serbia (8.6%, a difference of 0.11%).
| Demographics | Rating | Rank | Unemployment Among Women with Children Ages 6 to 17 years |
| Immigrants | South Africa | 98.3 /100 | #102 | Exceptional 8.6% |
| Scandinavians | 98.3 /100 | #103 | Exceptional 8.6% |
| Immigrants | France | 98.0 /100 | #104 | Exceptional 8.6% |
| Immigrants | Norway | 97.8 /100 | #105 | Exceptional 8.6% |
| Immigrants | Serbia | 97.7 /100 | #106 | Exceptional 8.6% |
| Chickasaw | 97.6 /100 | #107 | Exceptional 8.6% |
| Swedes | 97.6 /100 | #108 | Exceptional 8.6% |
| Immigrants | Romania | 97.5 /100 | #109 | Exceptional 8.6% |
| Latvians | 97.4 /100 | #110 | Exceptional 8.6% |
| Immigrants | Ukraine | 97.4 /100 | #111 | Exceptional 8.6% |
| Romanians | 97.1 /100 | #112 | Exceptional 8.6% |
| Eastern Europeans | 96.8 /100 | #113 | Exceptional 8.6% |
| Immigrants | Russia | 96.7 /100 | #114 | Exceptional 8.6% |
| Argentineans | 96.5 /100 | #115 | Exceptional 8.6% |
| Zimbabweans | 96.3 /100 | #116 | Exceptional 8.6% |