South American vs Immigrants from Panama Unemployment Among Women with Children Ages 6 to 17 years
COMPARE
South American
Immigrants from Panama
Unemployment Among Women with Children Ages 6 to 17 years
Unemployment Among Women with Children Ages 6 to 17 years Comparison
South Americans
Immigrants from Panama
9.5%
UNEMPLOYMENT AMONG WOMEN WITH CHILDREN AGES 6 TO 17 YEARS
0.5/ 100
METRIC RATING
261st/ 347
METRIC RANK
9.1%
UNEMPLOYMENT AMONG WOMEN WITH CHILDREN AGES 6 TO 17 YEARS
24.3/ 100
METRIC RATING
197th/ 347
METRIC RANK
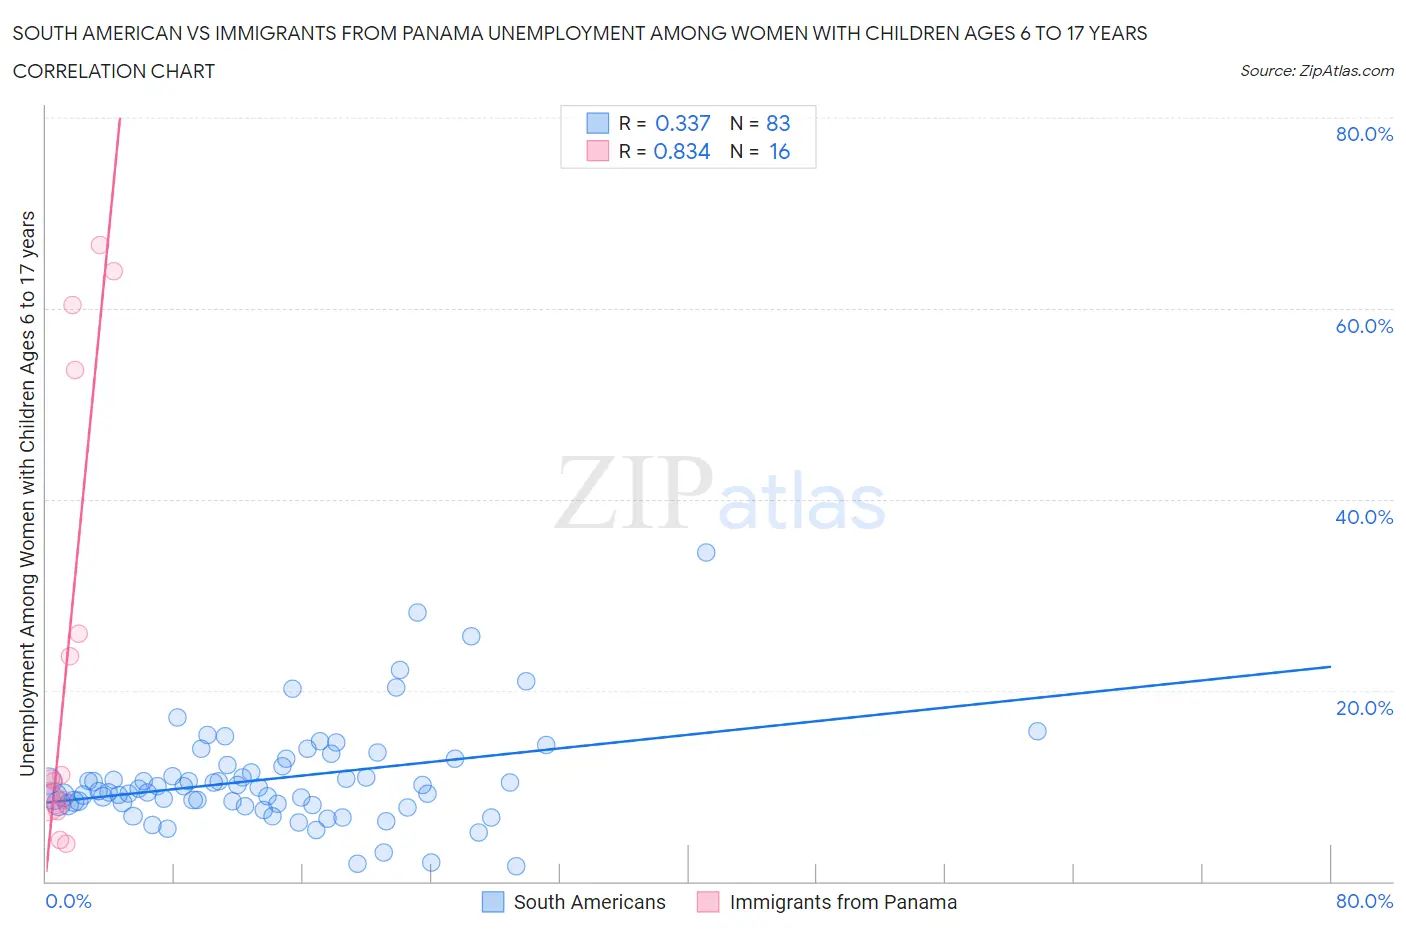
South American vs Immigrants from Panama Unemployment Among Women with Children Ages 6 to 17 years Correlation Chart
The statistical analysis conducted on geographies consisting of 336,338,597 people shows a mild positive correlation between the proportion of South Americans and unemployment rate among women with children between the ages 6 and 17 in the United States with a correlation coefficient (R) of 0.337 and weighted average of 9.5%. Similarly, the statistical analysis conducted on geographies consisting of 179,700,690 people shows a very strong positive correlation between the proportion of Immigrants from Panama and unemployment rate among women with children between the ages 6 and 17 in the United States with a correlation coefficient (R) of 0.834 and weighted average of 9.1%, a difference of 4.5%.
Unemployment Among Women with Children Ages 6 to 17 years Correlation Summary
| Measurement | South American | Immigrants from Panama |
| Minimum | 1.6% | 3.9% |
| Maximum | 34.5% | 66.7% |
| Range | 32.9% | 62.8% |
| Mean | 10.7% | 23.5% |
| Median | 9.7% | 10.6% |
| Interquartile 25% (IQ1) | 8.1% | 8.1% |
| Interquartile 75% (IQ3) | 12.2% | 39.7% |
| Interquartile Range (IQR) | 4.1% | 31.6% |
| Standard Deviation (Sample) | 5.4% | 23.3% |
| Standard Deviation (Population) | 5.3% | 22.6% |
Similar Demographics by Unemployment Among Women with Children Ages 6 to 17 years
Demographics Similar to South Americans by Unemployment Among Women with Children Ages 6 to 17 years
In terms of unemployment among women with children ages 6 to 17 years, the demographic groups most similar to South Americans are Senegalese (9.5%, a difference of 0.050%), Italian (9.5%, a difference of 0.080%), Lebanese (9.5%, a difference of 0.090%), Immigrants from Central America (9.5%, a difference of 0.19%), and Immigrants from Mexico (9.5%, a difference of 0.29%).
| Demographics | Rating | Rank | Unemployment Among Women with Children Ages 6 to 17 years |
| Nicaraguans | 1.0 /100 | #254 | Tragic 9.4% |
| Lithuanians | 0.9 /100 | #255 | Tragic 9.4% |
| Canadians | 0.8 /100 | #256 | Tragic 9.4% |
| Celtics | 0.7 /100 | #257 | Tragic 9.5% |
| Immigrants | Mexico | 0.7 /100 | #258 | Tragic 9.5% |
| Immigrants | Central America | 0.6 /100 | #259 | Tragic 9.5% |
| Italians | 0.6 /100 | #260 | Tragic 9.5% |
| South Americans | 0.5 /100 | #261 | Tragic 9.5% |
| Senegalese | 0.5 /100 | #262 | Tragic 9.5% |
| Lebanese | 0.5 /100 | #263 | Tragic 9.5% |
| Immigrants | Ghana | 0.4 /100 | #264 | Tragic 9.5% |
| West Indians | 0.4 /100 | #265 | Tragic 9.5% |
| Immigrants | Jamaica | 0.3 /100 | #266 | Tragic 9.5% |
| Irish | 0.3 /100 | #267 | Tragic 9.5% |
| Ghanaians | 0.2 /100 | #268 | Tragic 9.6% |
Demographics Similar to Immigrants from Panama by Unemployment Among Women with Children Ages 6 to 17 years
In terms of unemployment among women with children ages 6 to 17 years, the demographic groups most similar to Immigrants from Panama are Brazilian (9.1%, a difference of 0.010%), Austrian (9.1%, a difference of 0.040%), Immigrants from Kazakhstan (9.1%, a difference of 0.060%), Immigrants from Turkey (9.1%, a difference of 0.090%), and Guyanese (9.1%, a difference of 0.15%).
| Demographics | Rating | Rank | Unemployment Among Women with Children Ages 6 to 17 years |
| Slovenes | 28.5 /100 | #190 | Fair 9.1% |
| Belizeans | 28.4 /100 | #191 | Fair 9.1% |
| Guamanians/Chamorros | 27.2 /100 | #192 | Fair 9.1% |
| Immigrants | Turkey | 25.8 /100 | #193 | Fair 9.1% |
| Immigrants | Kazakhstan | 25.3 /100 | #194 | Fair 9.1% |
| Austrians | 25.0 /100 | #195 | Fair 9.1% |
| Brazilians | 24.4 /100 | #196 | Fair 9.1% |
| Immigrants | Panama | 24.3 /100 | #197 | Fair 9.1% |
| Guyanese | 21.8 /100 | #198 | Fair 9.1% |
| Czechoslovakians | 20.8 /100 | #199 | Fair 9.1% |
| Trinidadians and Tobagonians | 18.2 /100 | #200 | Poor 9.1% |
| Immigrants | Trinidad and Tobago | 16.7 /100 | #201 | Poor 9.1% |
| Immigrants | Middle Africa | 15.6 /100 | #202 | Poor 9.1% |
| Maltese | 15.3 /100 | #203 | Poor 9.1% |
| Immigrants | Canada | 15.3 /100 | #204 | Poor 9.1% |