Immigrants from Kuwait vs Jordanian Unemployment
COMPARE
Immigrants from Kuwait
Jordanian
Unemployment
Unemployment Comparison
Immigrants from Kuwait
Jordanians
5.0%
UNEMPLOYMENT
93.7/ 100
METRIC RATING
108th/ 347
METRIC RANK
5.0%
UNEMPLOYMENT
96.4/ 100
METRIC RATING
89th/ 347
METRIC RANK
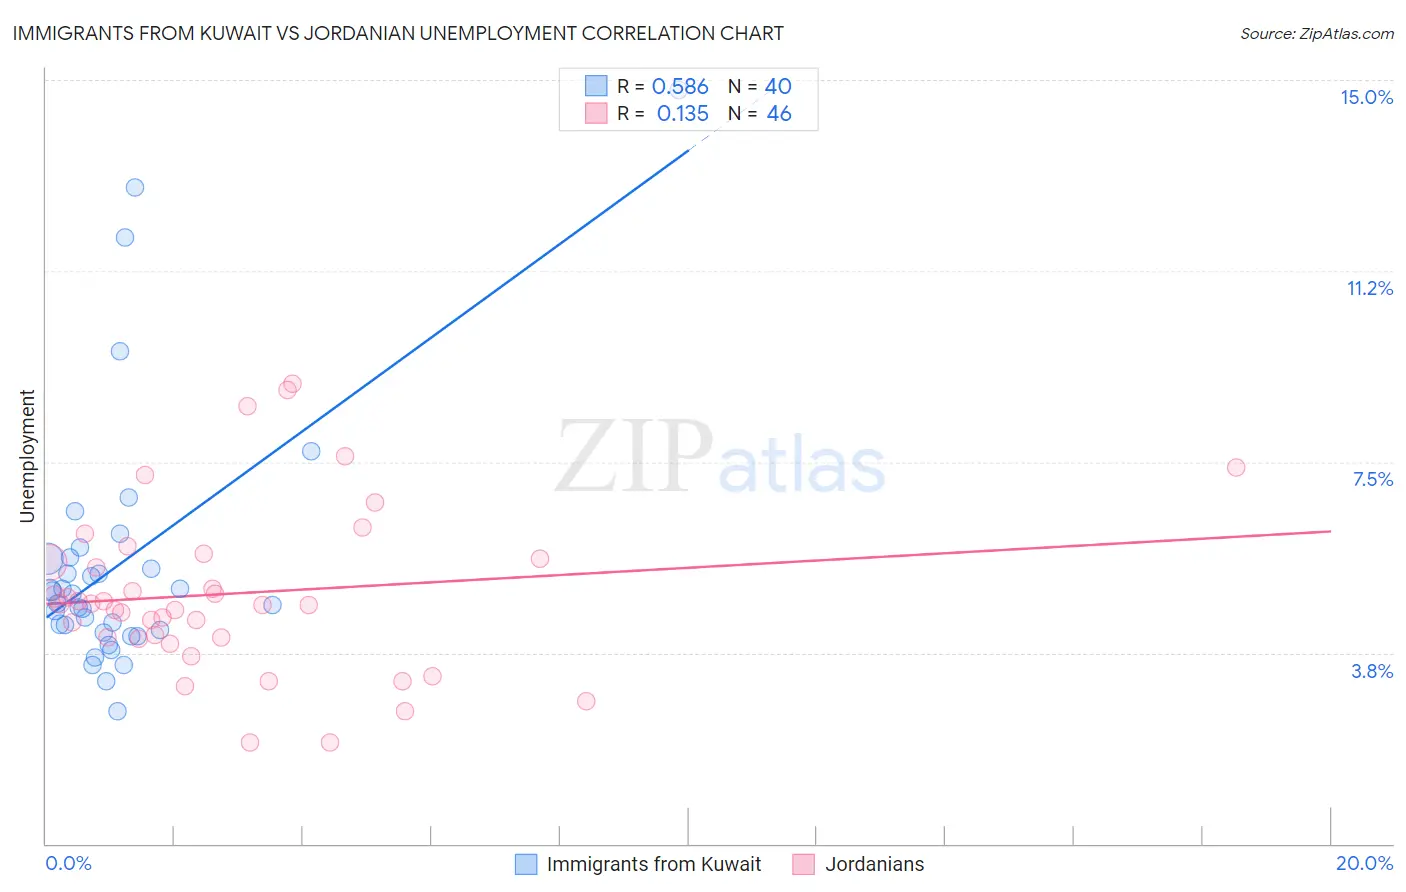
Immigrants from Kuwait vs Jordanian Unemployment Correlation Chart
The statistical analysis conducted on geographies consisting of 136,907,851 people shows a substantial positive correlation between the proportion of Immigrants from Kuwait and unemployment in the United States with a correlation coefficient (R) of 0.586 and weighted average of 5.0%. Similarly, the statistical analysis conducted on geographies consisting of 166,387,098 people shows a poor positive correlation between the proportion of Jordanians and unemployment in the United States with a correlation coefficient (R) of 0.135 and weighted average of 5.0%, a difference of 0.95%.
Unemployment Correlation Summary
| Measurement | Immigrants from Kuwait | Jordanian |
| Minimum | 2.6% | 2.0% |
| Maximum | 14.8% | 9.0% |
| Range | 12.2% | 7.0% |
| Mean | 5.5% | 4.9% |
| Median | 4.8% | 4.7% |
| Interquartile 25% (IQ1) | 4.2% | 4.1% |
| Interquartile 75% (IQ3) | 5.6% | 5.6% |
| Interquartile Range (IQR) | 1.4% | 1.5% |
| Standard Deviation (Sample) | 2.6% | 1.6% |
| Standard Deviation (Population) | 2.5% | 1.6% |
Demographics Similar to Immigrants from Kuwait and Jordanians by Unemployment
In terms of unemployment, the demographic groups most similar to Immigrants from Kuwait are Immigrants from Turkey (5.0%, a difference of 0.010%), Immigrants from Romania (5.0%, a difference of 0.020%), Chickasaw (5.0%, a difference of 0.080%), Osage (5.0%, a difference of 0.080%), and Maltese (5.0%, a difference of 0.080%). Similarly, the demographic groups most similar to Jordanians are Immigrants from North Macedonia (5.0%, a difference of 0.040%), Immigrants from Sudan (5.0%, a difference of 0.050%), Immigrants from South Africa (5.0%, a difference of 0.070%), Immigrants from Korea (5.0%, a difference of 0.090%), and Ukrainian (5.0%, a difference of 0.16%).
| Demographics | Rating | Rank | Unemployment |
| Immigrants | Korea | 96.6 /100 | #88 | Exceptional 5.0% |
| Jordanians | 96.4 /100 | #89 | Exceptional 5.0% |
| Immigrants | North Macedonia | 96.3 /100 | #90 | Exceptional 5.0% |
| Immigrants | Sudan | 96.3 /100 | #91 | Exceptional 5.0% |
| Immigrants | South Africa | 96.2 /100 | #92 | Exceptional 5.0% |
| Ukrainians | 96.0 /100 | #93 | Exceptional 5.0% |
| Immigrants | Austria | 95.9 /100 | #94 | Exceptional 5.0% |
| Immigrants | Serbia | 95.6 /100 | #95 | Exceptional 5.0% |
| Immigrants | England | 95.2 /100 | #96 | Exceptional 5.0% |
| Immigrants | Czechoslovakia | 95.1 /100 | #97 | Exceptional 5.0% |
| Romanians | 95.0 /100 | #98 | Exceptional 5.0% |
| Mongolians | 94.8 /100 | #99 | Exceptional 5.0% |
| Estonians | 94.6 /100 | #100 | Exceptional 5.0% |
| Americans | 94.3 /100 | #101 | Exceptional 5.0% |
| Immigrants | Argentina | 94.1 /100 | #102 | Exceptional 5.0% |
| Chickasaw | 94.0 /100 | #103 | Exceptional 5.0% |
| Osage | 94.0 /100 | #104 | Exceptional 5.0% |
| Maltese | 94.0 /100 | #105 | Exceptional 5.0% |
| Immigrants | Romania | 93.7 /100 | #106 | Exceptional 5.0% |
| Immigrants | Turkey | 93.7 /100 | #107 | Exceptional 5.0% |
| Immigrants | Kuwait | 93.7 /100 | #108 | Exceptional 5.0% |