Immigrants from India vs Immigrants from Micronesia Unemployment
COMPARE
Immigrants from India
Immigrants from Micronesia
Unemployment
Unemployment Comparison
Immigrants from India
Immigrants from Micronesia
4.5%
UNEMPLOYMENT
100.0/ 100
METRIC RATING
7th/ 347
METRIC RANK
5.3%
UNEMPLOYMENT
25.2/ 100
METRIC RATING
203rd/ 347
METRIC RANK
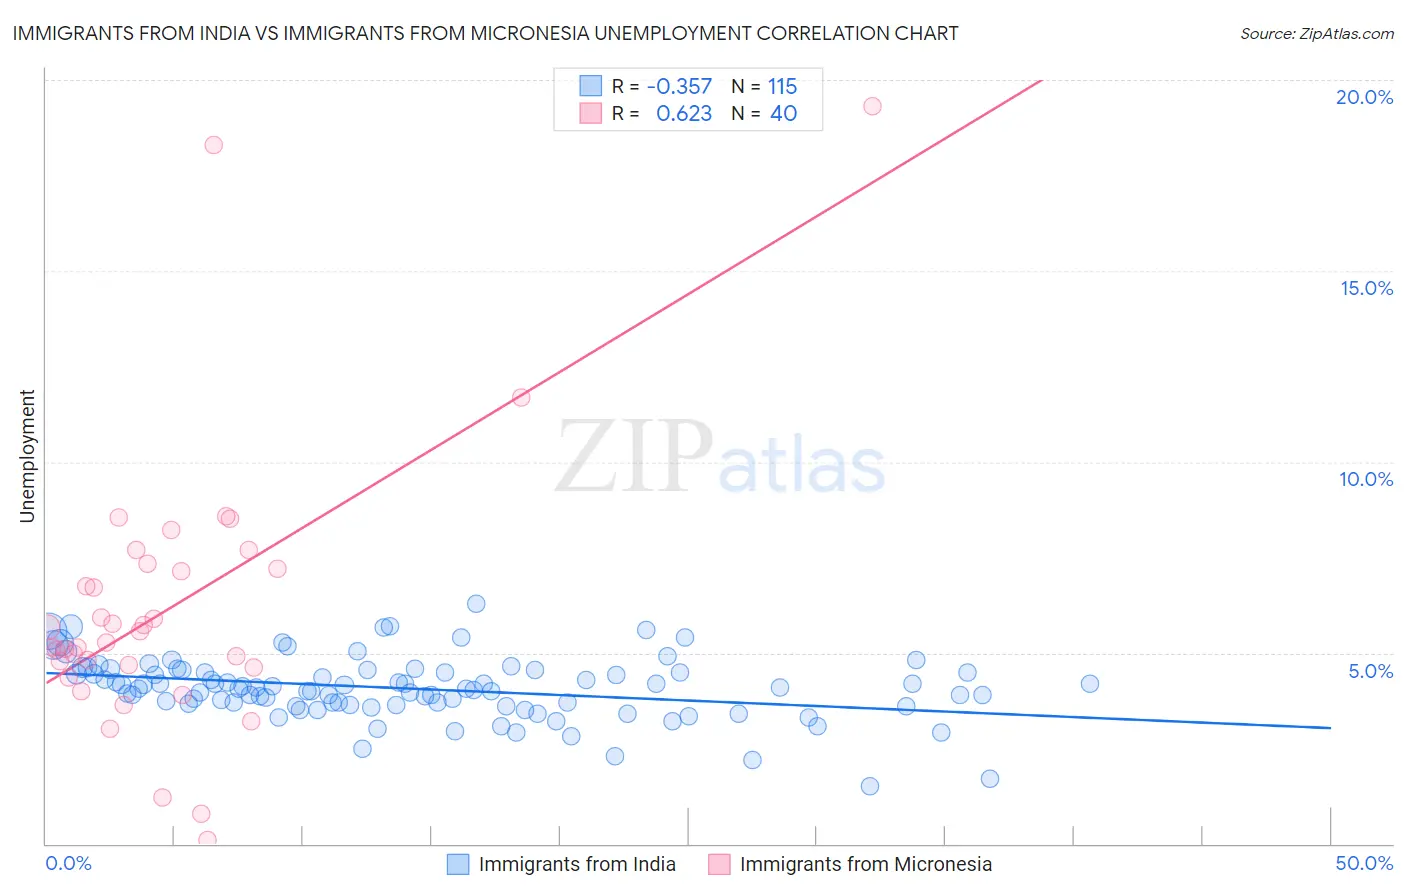
Immigrants from India vs Immigrants from Micronesia Unemployment Correlation Chart
The statistical analysis conducted on geographies consisting of 433,651,365 people shows a mild negative correlation between the proportion of Immigrants from India and unemployment in the United States with a correlation coefficient (R) of -0.357 and weighted average of 4.5%. Similarly, the statistical analysis conducted on geographies consisting of 61,596,499 people shows a significant positive correlation between the proportion of Immigrants from Micronesia and unemployment in the United States with a correlation coefficient (R) of 0.623 and weighted average of 5.3%, a difference of 18.6%.
Unemployment Correlation Summary
| Measurement | Immigrants from India | Immigrants from Micronesia |
| Minimum | 1.5% | 0.10% |
| Maximum | 6.3% | 19.3% |
| Range | 4.8% | 19.2% |
| Mean | 4.1% | 6.2% |
| Median | 4.1% | 5.4% |
| Interquartile 25% (IQ1) | 3.6% | 4.6% |
| Interquartile 75% (IQ3) | 4.5% | 7.3% |
| Interquartile Range (IQR) | 0.85% | 2.6% |
| Standard Deviation (Sample) | 0.80% | 3.7% |
| Standard Deviation (Population) | 0.80% | 3.6% |
Similar Demographics by Unemployment
Demographics Similar to Immigrants from India by Unemployment
In terms of unemployment, the demographic groups most similar to Immigrants from India are Swiss (4.5%, a difference of 0.46%), German (4.5%, a difference of 0.55%), Scandinavian (4.5%, a difference of 0.86%), Swedish (4.4%, a difference of 1.3%), and Dutch (4.6%, a difference of 1.4%).
| Demographics | Rating | Rank | Unemployment |
| Norwegians | 100.0 /100 | #1 | Exceptional 4.2% |
| Luxembourgers | 100.0 /100 | #2 | Exceptional 4.3% |
| Czechs | 100.0 /100 | #3 | Exceptional 4.3% |
| Danes | 100.0 /100 | #4 | Exceptional 4.3% |
| Swedes | 100.0 /100 | #5 | Exceptional 4.4% |
| Germans | 100.0 /100 | #6 | Exceptional 4.5% |
| Immigrants | India | 100.0 /100 | #7 | Exceptional 4.5% |
| Swiss | 100.0 /100 | #8 | Exceptional 4.5% |
| Scandinavians | 100.0 /100 | #9 | Exceptional 4.5% |
| Dutch | 100.0 /100 | #10 | Exceptional 4.6% |
| English | 100.0 /100 | #11 | Exceptional 4.6% |
| Pennsylvania Germans | 100.0 /100 | #12 | Exceptional 4.6% |
| Belgians | 100.0 /100 | #13 | Exceptional 4.6% |
| Immigrants | Cuba | 100.0 /100 | #14 | Exceptional 4.6% |
| Europeans | 99.9 /100 | #15 | Exceptional 4.6% |
Demographics Similar to Immigrants from Micronesia by Unemployment
In terms of unemployment, the demographic groups most similar to Immigrants from Micronesia are Cherokee (5.3%, a difference of 0.030%), Immigrants from Ukraine (5.3%, a difference of 0.030%), Native Hawaiian (5.3%, a difference of 0.080%), Immigrants from South Eastern Asia (5.3%, a difference of 0.14%), and Korean (5.3%, a difference of 0.17%).
| Demographics | Rating | Rank | Unemployment |
| Peruvians | 29.9 /100 | #196 | Fair 5.3% |
| Immigrants | Uruguay | 29.8 /100 | #197 | Fair 5.3% |
| Immigrants | Israel | 28.6 /100 | #198 | Fair 5.3% |
| Immigrants | Afghanistan | 28.6 /100 | #199 | Fair 5.3% |
| Koreans | 27.4 /100 | #200 | Fair 5.3% |
| Immigrants | South Eastern Asia | 27.0 /100 | #201 | Fair 5.3% |
| Cherokee | 25.5 /100 | #202 | Fair 5.3% |
| Immigrants | Micronesia | 25.2 /100 | #203 | Fair 5.3% |
| Immigrants | Ukraine | 24.9 /100 | #204 | Fair 5.3% |
| Native Hawaiians | 24.1 /100 | #205 | Fair 5.3% |
| Immigrants | Peru | 22.7 /100 | #206 | Fair 5.4% |
| Creek | 19.4 /100 | #207 | Poor 5.4% |
| Portuguese | 19.0 /100 | #208 | Poor 5.4% |
| Immigrants | Iran | 18.8 /100 | #209 | Poor 5.4% |
| Immigrants | Iraq | 18.6 /100 | #210 | Poor 5.4% |