South American Indian vs Carpatho Rusyn Unemployment Among Ages 16 to 19 years
COMPARE
South American Indian
Carpatho Rusyn
Unemployment Among Ages 16 to 19 years
Unemployment Among Ages 16 to 19 years Comparison
South American Indians
Carpatho Rusyns
18.0%
UNEMPLOYMENT AMONG AGES 16 TO 19 YEARS
13.0/ 100
METRIC RATING
217th/ 347
METRIC RANK
17.9%
UNEMPLOYMENT AMONG AGES 16 TO 19 YEARS
15.6/ 100
METRIC RATING
210th/ 347
METRIC RANK
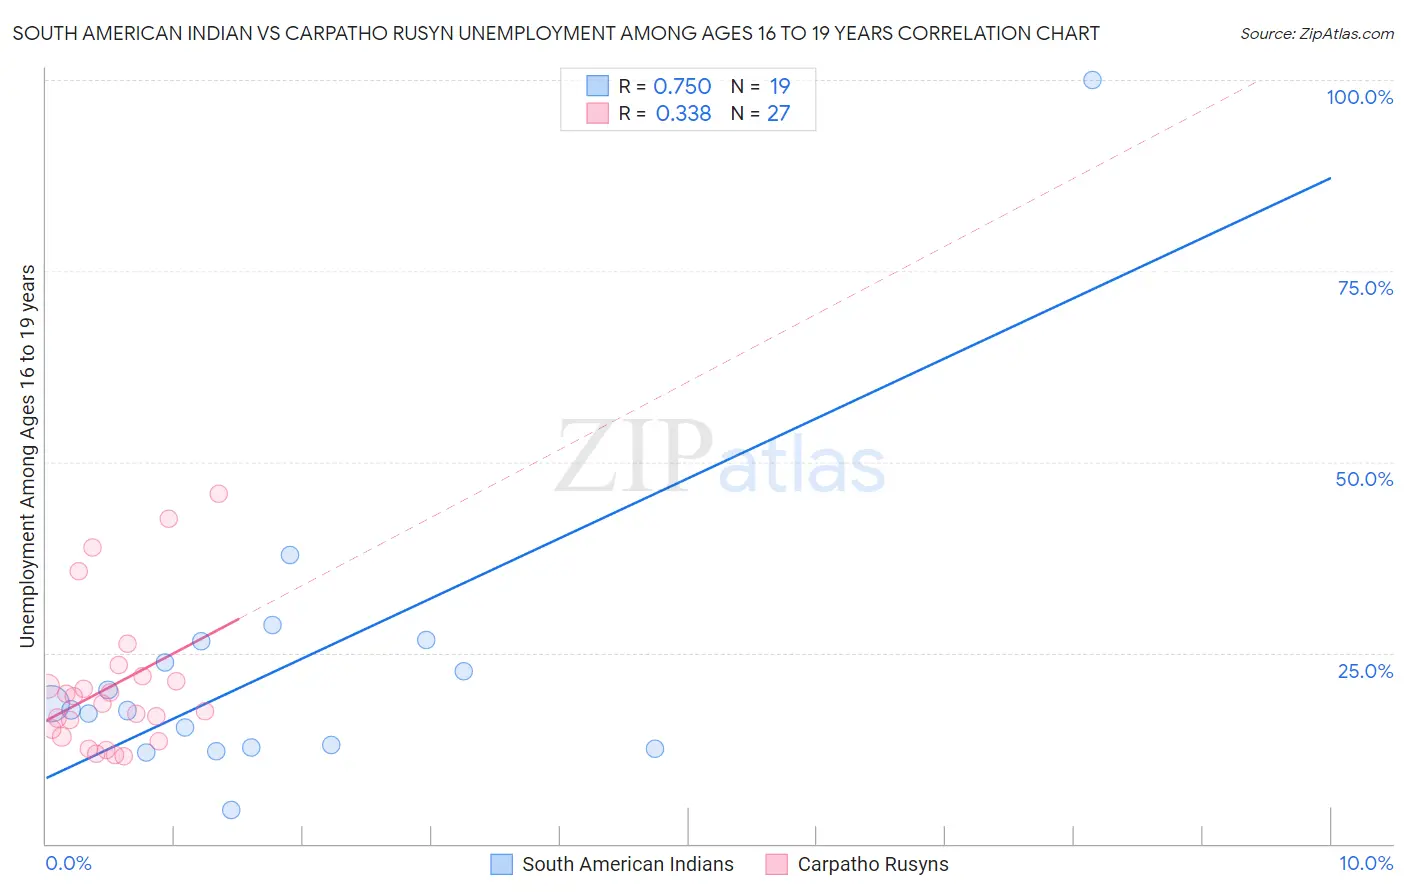
South American Indian vs Carpatho Rusyn Unemployment Among Ages 16 to 19 years Correlation Chart
The statistical analysis conducted on geographies consisting of 161,523,543 people shows a strong positive correlation between the proportion of South American Indians and unemployment rate among population between the ages 16 and 19 in the United States with a correlation coefficient (R) of 0.750 and weighted average of 18.0%. Similarly, the statistical analysis conducted on geographies consisting of 57,767,385 people shows a mild positive correlation between the proportion of Carpatho Rusyns and unemployment rate among population between the ages 16 and 19 in the United States with a correlation coefficient (R) of 0.338 and weighted average of 17.9%, a difference of 0.25%.
Unemployment Among Ages 16 to 19 years Correlation Summary
| Measurement | South American Indian | Carpatho Rusyn |
| Minimum | 4.5% | 11.5% |
| Maximum | 100.0% | 45.9% |
| Range | 95.5% | 34.4% |
| Mean | 23.1% | 20.7% |
| Median | 17.5% | 18.3% |
| Interquartile 25% (IQ1) | 12.6% | 14.0% |
| Interquartile 75% (IQ3) | 26.5% | 21.9% |
| Interquartile Range (IQR) | 13.9% | 7.9% |
| Standard Deviation (Sample) | 20.1% | 9.4% |
| Standard Deviation (Population) | 19.6% | 9.2% |
Demographics Similar to South American Indians and Carpatho Rusyns by Unemployment Among Ages 16 to 19 years
In terms of unemployment among ages 16 to 19 years, the demographic groups most similar to South American Indians are Immigrants from Kazakhstan (18.0%, a difference of 0.0%), Immigrants from Syria (18.0%, a difference of 0.040%), Immigrants from Argentina (18.0%, a difference of 0.050%), Immigrants from Morocco (18.0%, a difference of 0.060%), and Chippewa (18.0%, a difference of 0.080%). Similarly, the demographic groups most similar to Carpatho Rusyns are Cherokee (17.9%, a difference of 0.010%), Hawaiian (17.9%, a difference of 0.10%), Guamanian/Chamorro (17.9%, a difference of 0.10%), Argentinean (18.0%, a difference of 0.16%), and Chippewa (18.0%, a difference of 0.17%).
| Demographics | Rating | Rank | Unemployment Among Ages 16 to 19 years |
| Immigrants | Eastern Europe | 23.6 /100 | #203 | Fair 17.8% |
| Immigrants | Nonimmigrants | 20.9 /100 | #204 | Fair 17.9% |
| Assyrians/Chaldeans/Syriacs | 20.8 /100 | #205 | Fair 17.9% |
| Immigrants | Southern Europe | 18.9 /100 | #206 | Poor 17.9% |
| Liberians | 18.6 /100 | #207 | Poor 17.9% |
| Hawaiians | 16.8 /100 | #208 | Poor 17.9% |
| Cherokee | 15.7 /100 | #209 | Poor 17.9% |
| Carpatho Rusyns | 15.6 /100 | #210 | Poor 17.9% |
| Guamanians/Chamorros | 14.5 /100 | #211 | Poor 17.9% |
| Argentineans | 13.8 /100 | #212 | Poor 18.0% |
| Chippewa | 13.7 /100 | #213 | Poor 18.0% |
| Immigrants | Morocco | 13.5 /100 | #214 | Poor 18.0% |
| Immigrants | Syria | 13.3 /100 | #215 | Poor 18.0% |
| Immigrants | Kazakhstan | 13.0 /100 | #216 | Poor 18.0% |
| South American Indians | 13.0 /100 | #217 | Poor 18.0% |
| Immigrants | Argentina | 12.5 /100 | #218 | Poor 18.0% |
| Immigrants | Africa | 12.0 /100 | #219 | Poor 18.0% |
| Immigrants | Albania | 11.4 /100 | #220 | Poor 18.0% |
| Immigrants | Spain | 11.4 /100 | #221 | Poor 18.0% |
| Immigrants | Iran | 10.7 /100 | #222 | Poor 18.0% |
| Immigrants | Western Asia | 10.2 /100 | #223 | Poor 18.0% |