South African vs Immigrants from Eastern Europe Unemployment Among Ages 45 to 54 years

COMPARE

South African
Race
Ancestry
AfghanAfricanAlaska NativeAlaskan AthabascanAlbanianAleutAlsatianAmericanApacheArabArapahoArgentineanArmenianAssyrian/Chaldean/SyriacAustralianAustrianBahamianBangladeshiBarbadianBasqueBelgianBelizeanBermudanBhutaneseBlackfeetBolivianBrazilianBritishBritish West IndianBulgarianBurmeseCajunCambodianCanadianCape VerdeanCarpatho RusynCelticCentral AmericanCentral American IndianCherokeeCheyenneChickasawChileanChineseChippewaChoctawColombianColvilleComancheCosta RicanCreeCreekCroatianCrowCubanCypriotCzechCzechoslovakianDanishDelawareDominicanDutchDutch West IndianEastern EuropeanEcuadorianEgyptianEnglishEstonianEthiopianEuropeanFijianFilipinoFinnishFrenchFrench American IndianFrench CanadianGermanGerman RussianGhanaianGreekGuamanian/ChamorroGuatemalanGuyaneseHaitianHmongHonduranHopiHoumaHungarianIcelanderIndian (Asian)IndonesianInupiatIranianIraqiIrishIroquoisIsraeliItalianJamaicanJapaneseJordanianKenyanKiowaKoreanLaotianLatvianLebaneseLiberianLithuanianLumbeeLuxembourgerMacedonianMalaysianMalteseMarshalleseMenomineeMexicanMexican American IndianMongolianMoroccanNative HawaiianNavajoNepaleseNew ZealanderNicaraguanNigerianNorthern EuropeanNorwegianOkinawanOsageOttawaPaiutePakistaniPalestinianPanamanianParaguayanPennsylvania GermanPeruvianPimaPolishPortuguesePotawatomiPuebloPuerto RicanPuget Sound SalishRomanianRussianSalvadoranSamoanScandinavianScotch-IrishScottishSeminoleSenegaleseSerbianShoshoneSierra LeoneanSiouxSlavicSlovakSloveneSomaliSouth AfricanSouth AmericanSouth American IndianSoviet UnionSpaniardSpanishSpanish AmericanSpanish American IndianSri LankanSubsaharan AfricanSudaneseSwedishSwissSyrianTaiwaneseThaiTlingit-HaidaTohono O'OdhamTonganTrinidadian and TobagonianTsimshianTurkishU.S. Virgin IslanderUgandanUkrainianUruguayanUteVenezuelanVietnameseWelshWest IndianYakamaYaquiYugoslavianYumanYup'ikZimbabwean
Immigration
NonimmigrantsImmigrantsAfghanistanAfricaAlbaniaArgentinaArmeniaAsiaAustraliaAustriaBahamasBangladeshBarbadosBelarusBelgiumBelizeBoliviaBosnia and HerzegovinaBrazilBulgariaBurma/MyanmarCabo VerdeCambodiaCameroonCanadaCaribbeanCentral AmericaChileChinaColombiaCongoCosta RicaCroatiaCubaCzechoslovakiaDenmarkDominicaDominican RepublicEastern AfricaEastern AsiaEcuadorEgyptEl SalvadorEnglandEritreaEthiopiaEuropeFijiFranceGermanyGhanaGreeceGrenadaGuatemalaGuyanaHaitiHondurasHong KongHungaryIndiaIndonesiaIranIraqIrelandIsraelItalyJamaicaJapanJordanKazakhstanKenyaKoreaKuwaitLaosLatin AmericaLatviaLebanonLiberiaLithuaniaMalaysiaMexicoMicronesiaMiddle AfricaMoldovaMoroccoNepalNetherlandsNicaraguaNigeriaNorth AmericaNorth MacedoniaNorthern AfricaNorthern EuropeNorwayOceaniaPakistanPanamaPeruPhilippinesPolandPortugalRomaniaRussiaSaudi ArabiaScotlandSenegalSerbiaSierra LeoneSingaporeSomaliaSouth AfricaSouth AmericaSouth Central AsiaSouth Eastern AsiaSouthern EuropeSpainSri LankaSt. Vincent and the GrenadinesSudanSwedenSwitzerlandSyriaTaiwanThailandTrinidad and TobagoTurkeyUgandaUkraineUruguayUzbekistanVenezuelaVietnamWest IndiesWestern AfricaWestern AsiaWestern EuropeYemenZaireZimbabweAzores
Immigrants from Eastern Europe
Race
Ancestry
AfghanAfricanAlaska NativeAlaskan AthabascanAlbanianAleutAlsatianAmericanApacheArabArapahoArgentineanArmenianAssyrian/Chaldean/SyriacAustralianAustrianBahamianBangladeshiBarbadianBasqueBelgianBelizeanBermudanBhutaneseBlackfeetBolivianBrazilianBritishBritish West IndianBulgarianBurmeseCajunCambodianCanadianCape VerdeanCarpatho RusynCelticCentral AmericanCentral American IndianCherokeeCheyenneChickasawChileanChineseChippewaChoctawColombianColvilleComancheCosta RicanCreeCreekCroatianCrowCubanCypriotCzechCzechoslovakianDanishDelawareDominicanDutchDutch West IndianEastern EuropeanEcuadorianEgyptianEnglishEstonianEthiopianEuropeanFijianFilipinoFinnishFrenchFrench American IndianFrench CanadianGermanGerman RussianGhanaianGreekGuamanian/ChamorroGuatemalanGuyaneseHaitianHmongHonduranHopiHoumaHungarianIcelanderIndian (Asian)IndonesianInupiatIranianIraqiIrishIroquoisIsraeliItalianJamaicanJapaneseJordanianKenyanKiowaKoreanLaotianLatvianLebaneseLiberianLithuanianLumbeeLuxembourgerMacedonianMalaysianMalteseMarshalleseMenomineeMexicanMexican American IndianMongolianMoroccanNative HawaiianNavajoNepaleseNew ZealanderNicaraguanNigerianNorthern EuropeanNorwegianOkinawanOsageOttawaPaiutePakistaniPalestinianPanamanianParaguayanPennsylvania GermanPeruvianPimaPolishPortuguesePotawatomiPuebloPuerto RicanPuget Sound SalishRomanianRussianSalvadoranSamoanScandinavianScotch-IrishScottishSeminoleSenegaleseSerbianShoshoneSierra LeoneanSiouxSlavicSlovakSloveneSomaliSouth AmericanSouth American IndianSoviet UnionSpaniardSpanishSpanish AmericanSpanish American IndianSri LankanSubsaharan AfricanSudaneseSwedishSwissSyrianTaiwaneseThaiTlingit-HaidaTohono O'OdhamTonganTrinidadian and TobagonianTsimshianTurkishU.S. Virgin IslanderUgandanUkrainianUruguayanUteVenezuelanVietnameseWelshWest IndianYakamaYaquiYugoslavianYumanYup'ikZimbabwean
Immigration
NonimmigrantsImmigrantsAfghanistanAfricaAlbaniaArgentinaArmeniaAsiaAustraliaAustriaBahamasBangladeshBarbadosBelarusBelgiumBelizeBoliviaBosnia and HerzegovinaBrazilBulgariaBurma/MyanmarCabo VerdeCambodiaCameroonCanadaCaribbeanCentral AmericaChileChinaColombiaCongoCosta RicaCroatiaCubaCzechoslovakiaDenmarkDominicaDominican RepublicEastern AfricaEastern AsiaEastern EuropeEcuadorEgyptEl SalvadorEnglandEritreaEthiopiaEuropeFijiFranceGermanyGhanaGreeceGrenadaGuatemalaGuyanaHaitiHondurasHong KongHungaryIndiaIndonesiaIranIraqIrelandIsraelItalyJamaicaJapanJordanKazakhstanKenyaKoreaKuwaitLaosLatin AmericaLatviaLebanonLiberiaLithuaniaMalaysiaMexicoMicronesiaMiddle AfricaMoldovaMoroccoNepalNetherlandsNicaraguaNigeriaNorth AmericaNorth MacedoniaNorthern AfricaNorthern EuropeNorwayOceaniaPakistanPanamaPeruPhilippinesPolandPortugalRomaniaRussiaSaudi ArabiaScotlandSenegalSerbiaSierra LeoneSingaporeSomaliaSouth AfricaSouth AmericaSouth Central AsiaSouth Eastern AsiaSouthern EuropeSpainSri LankaSt. Vincent and the GrenadinesSudanSwedenSwitzerlandSyriaTaiwanThailandTrinidad and TobagoTurkeyUgandaUkraineUruguayUzbekistanVenezuelaVietnamWest IndiesWestern AfricaWestern AsiaWestern EuropeYemenZaireZimbabweAzores
Unemployment Among Ages 45 to 54 years
Income
Poverty
Unemployment
Labor Participation
Family Structure
Vehicle Availability
Education Level
Disability

Unemployment Among Ages 45 to 54 years Comparison

South Africans

Immigrants from Eastern Europe

Exceptional
Good
4.4%
UNEMPLOYMENT AMONG AGES 45 TO 54 YEARS
90.4/ 100
METRIC RATING
117th/ 347
METRIC RANK
4.5%
UNEMPLOYMENT AMONG AGES 45 TO 54 YEARS
61.6/ 100
METRIC RATING
161st/ 347
METRIC RANK

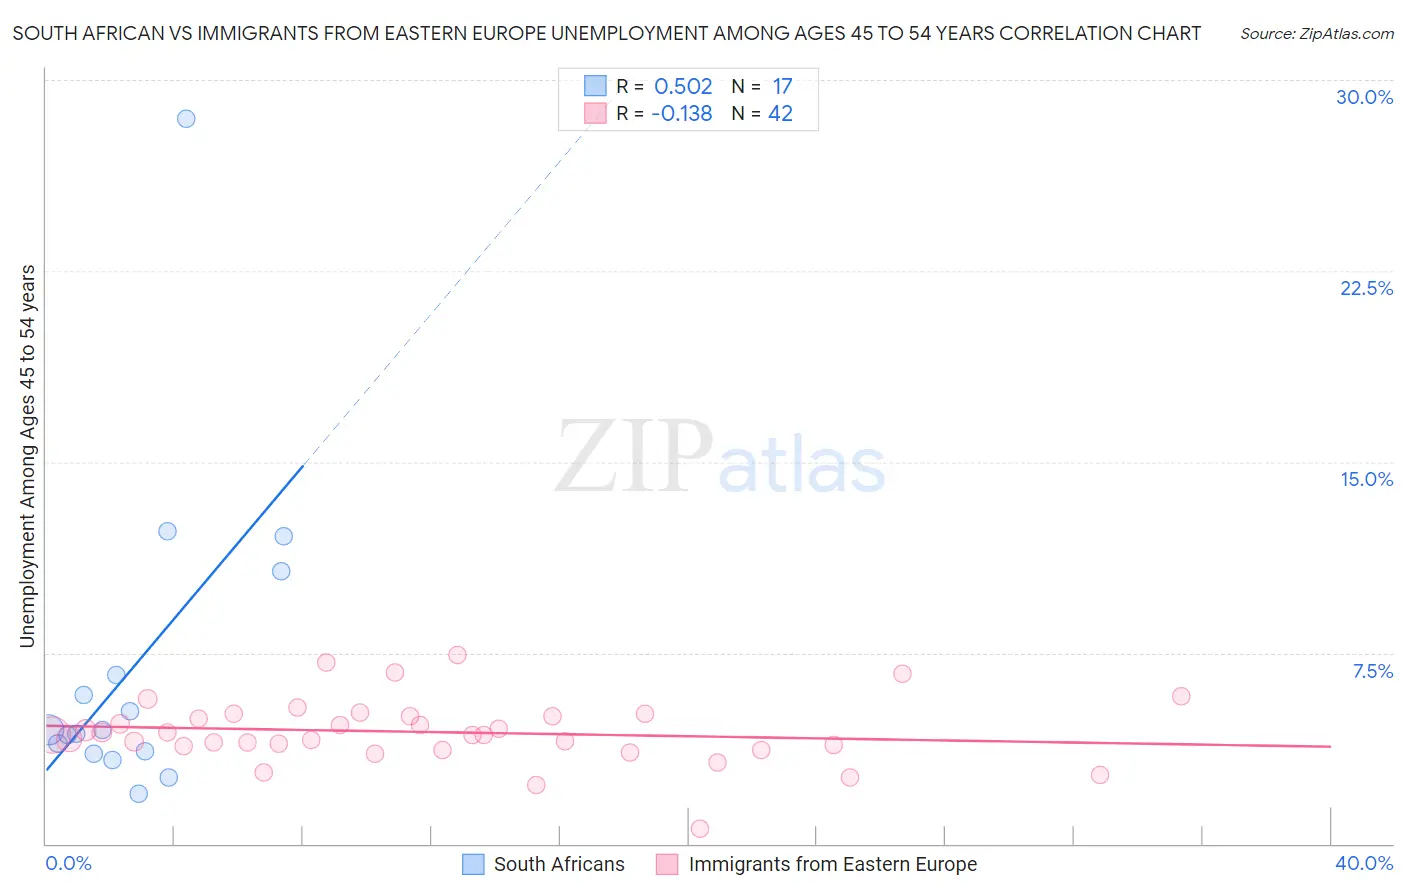
South African vs Immigrants from Eastern Europe Unemployment Among Ages 45 to 54 years Correlation Chart

The statistical analysis conducted on geographies consisting of 180,291,072 people shows a substantial positive correlation between the proportion of South Africans and unemployment rate among population between the ages 45 and 54 in the United States with a correlation coefficient (R) of 0.502 and weighted average of 4.4%. Similarly, the statistical analysis conducted on geographies consisting of 457,626,401 people shows a poor negative correlation between the proportion of Immigrants from Eastern Europe and unemployment rate among population between the ages 45 and 54 in the United States with a correlation coefficient (R) of -0.138 and weighted average of 4.5%, a difference of 2.1%.
South African vs Immigrants from Eastern Europe Unemployment Among Ages 45 to 54 years

Unemployment Among Ages 45 to 54 years Correlation Summary

MeasurementSouth AfricanImmigrants from Eastern Europe
Minimum2.0%0.60%
Maximum28.5%7.4%
Range26.5%6.8%
Mean6.9%4.4%
Median4.4%4.3%
Interquartile 25% (IQ1)3.6%3.8%
Interquartile 75% (IQ3)8.7%5.0%
Interquartile Range (IQR)5.1%1.2%
Standard Deviation (Sample)6.4%1.3%
Standard Deviation (Population)6.2%1.3%

Similar Demographics by Unemployment Among Ages 45 to 54 years

Demographics Similar to South Africans by Unemployment Among Ages 45 to 54 years

In terms of unemployment among ages 45 to 54 years, the demographic groups most similar to South Africans are Immigrants from North Macedonia (4.4%, a difference of 0.030%), Pakistani (4.4%, a difference of 0.040%), Immigrants from Chile (4.4%, a difference of 0.060%), Immigrants from Romania (4.4%, a difference of 0.060%), and Native Hawaiian (4.4%, a difference of 0.070%).
DemographicsRating | RankUnemployment Among Ages 45 to 54 years
Immigrants | England
91.3
/100
|
#110
Exceptional
4.4%
Immigrants | Nicaragua
91.3
/100
|
#111
Exceptional
4.4%
Immigrants | Saudi Arabia
91.1
/100
|
#112
Exceptional
4.4%
French Canadians
91.0
/100
|
#113
Exceptional
4.4%
Immigrants | Chile
90.9
/100
|
#114
Exceptional
4.4%
Pakistanis
90.7
/100
|
#115
Exceptional
4.4%
Immigrants | North Macedonia
90.6
/100
|
#116
Exceptional
4.4%
South Africans
90.4
/100
|
#117
Exceptional
4.4%
Immigrants | Romania
90.0
/100
|
#118
Exceptional
4.4%
Native Hawaiians
90.0
/100
|
#119
Excellent
4.4%
Americans
89.6
/100
|
#120
Excellent
4.4%
Immigrants | Oceania
89.5
/100
|
#121
Excellent
4.4%
Immigrants | Kazakhstan
89.5
/100
|
#122
Excellent
4.4%
Immigrants | Asia
88.8
/100
|
#123
Excellent
4.4%
Spanish
88.8
/100
|
#124
Excellent
4.4%

Demographics Similar to Immigrants from Eastern Europe by Unemployment Among Ages 45 to 54 years

In terms of unemployment among ages 45 to 54 years, the demographic groups most similar to Immigrants from Eastern Europe are Immigrants from South Eastern Asia (4.5%, a difference of 0.020%), Nonimmigrants (4.5%, a difference of 0.060%), Immigrants from Indonesia (4.5%, a difference of 0.060%), Bangladeshi (4.5%, a difference of 0.090%), and Samoan (4.5%, a difference of 0.15%).
DemographicsRating | RankUnemployment Among Ages 45 to 54 years
Immigrants | Spain
72.5
/100
|
#154
Good
4.5%
Marshallese
70.6
/100
|
#155
Good
4.5%
Immigrants | Croatia
69.6
/100
|
#156
Good
4.5%
Indians (Asian)
68.1
/100
|
#157
Good
4.5%
Immigrants | Italy
65.5
/100
|
#158
Good
4.5%
Immigrants | Nonimmigrants
62.8
/100
|
#159
Good
4.5%
Immigrants | South Eastern Asia
62.0
/100
|
#160
Good
4.5%
Immigrants | Eastern Europe
61.6
/100
|
#161
Good
4.5%
Immigrants | Indonesia
60.3
/100
|
#162
Good
4.5%
Bangladeshis
59.7
/100
|
#163
Average
4.5%
Samoans
58.5
/100
|
#164
Average
4.5%
Maltese
57.9
/100
|
#165
Average
4.5%
Immigrants | Western Europe
57.4
/100
|
#166
Average
4.5%
Immigrants | Brazil
56.4
/100
|
#167
Average
4.5%
Immigrants | Europe
54.7
/100
|
#168
Average
4.5%