Japanese vs Immigrants from Eastern Europe Unemployment Among Ages 35 to 44 years
COMPARE
Japanese
Immigrants from Eastern Europe
Unemployment Among Ages 35 to 44 years
Unemployment Among Ages 35 to 44 years Comparison
Japanese
Immigrants from Eastern Europe
5.1%
UNEMPLOYMENT AMONG AGES 35 TO 44 YEARS
1.2/ 100
METRIC RATING
231st/ 347
METRIC RANK
4.6%
UNEMPLOYMENT AMONG AGES 35 TO 44 YEARS
74.7/ 100
METRIC RATING
145th/ 347
METRIC RANK
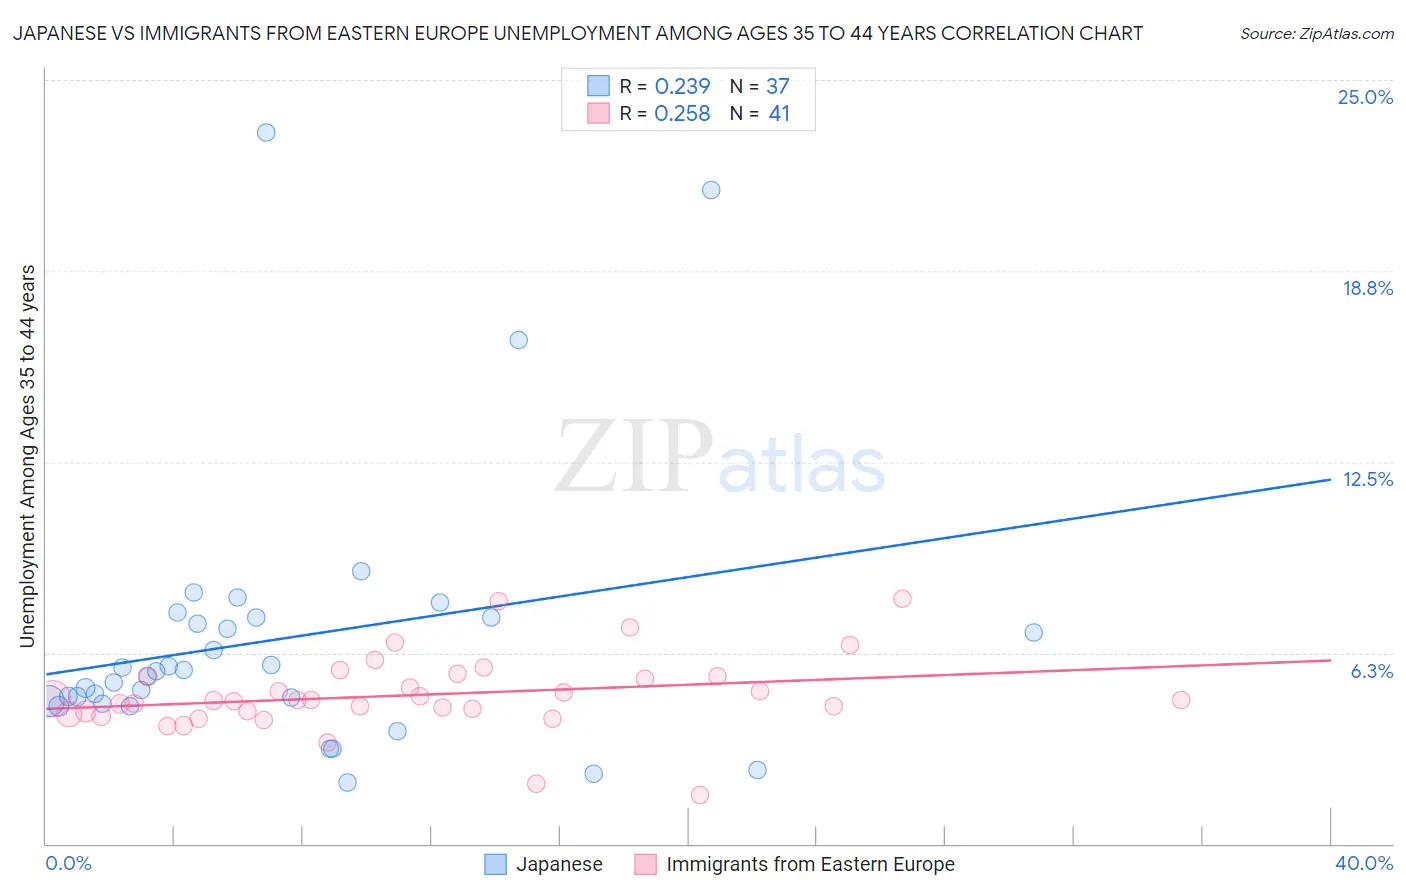
Japanese vs Immigrants from Eastern Europe Unemployment Among Ages 35 to 44 years Correlation Chart
The statistical analysis conducted on geographies consisting of 246,537,805 people shows a weak positive correlation between the proportion of Japanese and unemployment rate among population between the ages 35 and 44 in the United States with a correlation coefficient (R) of 0.239 and weighted average of 5.1%. Similarly, the statistical analysis conducted on geographies consisting of 458,804,175 people shows a weak positive correlation between the proportion of Immigrants from Eastern Europe and unemployment rate among population between the ages 35 and 44 in the United States with a correlation coefficient (R) of 0.258 and weighted average of 4.6%, a difference of 9.9%.
Unemployment Among Ages 35 to 44 years Correlation Summary
| Measurement | Japanese | Immigrants from Eastern Europe |
| Minimum | 2.0% | 1.6% |
| Maximum | 23.3% | 8.0% |
| Range | 21.3% | 6.4% |
| Mean | 6.7% | 4.9% |
| Median | 5.6% | 4.7% |
| Interquartile 25% (IQ1) | 4.6% | 4.3% |
| Interquartile 75% (IQ3) | 7.4% | 5.5% |
| Interquartile Range (IQR) | 2.8% | 1.2% |
| Standard Deviation (Sample) | 4.5% | 1.2% |
| Standard Deviation (Population) | 4.5% | 1.2% |
Similar Demographics by Unemployment Among Ages 35 to 44 years
Demographics Similar to Japanese by Unemployment Among Ages 35 to 44 years
In terms of unemployment among ages 35 to 44 years, the demographic groups most similar to Japanese are Liberian (5.1%, a difference of 0.030%), Iroquois (5.1%, a difference of 0.080%), Immigrants from Nigeria (5.1%, a difference of 0.13%), Portuguese (5.1%, a difference of 0.19%), and Immigrants from Cambodia (5.0%, a difference of 0.31%).
| Demographics | Rating | Rank | Unemployment Among Ages 35 to 44 years |
| Panamanians | 2.9 /100 | #224 | Tragic 5.0% |
| Immigrants | Lebanon | 2.7 /100 | #225 | Tragic 5.0% |
| Potawatomi | 2.5 /100 | #226 | Tragic 5.0% |
| Immigrants | Uzbekistan | 1.9 /100 | #227 | Tragic 5.0% |
| Samoans | 1.8 /100 | #228 | Tragic 5.0% |
| Immigrants | Cambodia | 1.5 /100 | #229 | Tragic 5.0% |
| Liberians | 1.3 /100 | #230 | Tragic 5.1% |
| Japanese | 1.2 /100 | #231 | Tragic 5.1% |
| Iroquois | 1.2 /100 | #232 | Tragic 5.1% |
| Immigrants | Nigeria | 1.2 /100 | #233 | Tragic 5.1% |
| Portuguese | 1.1 /100 | #234 | Tragic 5.1% |
| Guamanians/Chamorros | 0.9 /100 | #235 | Tragic 5.1% |
| Central Americans | 0.8 /100 | #236 | Tragic 5.1% |
| Kiowa | 0.8 /100 | #237 | Tragic 5.1% |
| Hondurans | 0.7 /100 | #238 | Tragic 5.1% |
Demographics Similar to Immigrants from Eastern Europe by Unemployment Among Ages 35 to 44 years
In terms of unemployment among ages 35 to 44 years, the demographic groups most similar to Immigrants from Eastern Europe are Immigrants from Denmark (4.6%, a difference of 0.020%), Immigrants from Russia (4.6%, a difference of 0.070%), Immigrants from Switzerland (4.6%, a difference of 0.080%), Immigrants from Vietnam (4.6%, a difference of 0.080%), and Ukrainian (4.6%, a difference of 0.11%).
| Demographics | Rating | Rank | Unemployment Among Ages 35 to 44 years |
| Immigrants | Norway | 77.5 /100 | #138 | Good 4.6% |
| Immigrants | Hungary | 76.3 /100 | #139 | Good 4.6% |
| Immigrants | Eastern Africa | 76.0 /100 | #140 | Good 4.6% |
| Canadians | 75.9 /100 | #141 | Good 4.6% |
| Ukrainians | 75.8 /100 | #142 | Good 4.6% |
| Immigrants | Switzerland | 75.5 /100 | #143 | Good 4.6% |
| Immigrants | Russia | 75.4 /100 | #144 | Good 4.6% |
| Immigrants | Eastern Europe | 74.7 /100 | #145 | Good 4.6% |
| Immigrants | Denmark | 74.4 /100 | #146 | Good 4.6% |
| Immigrants | Vietnam | 73.8 /100 | #147 | Good 4.6% |
| Slavs | 72.4 /100 | #148 | Good 4.6% |
| Immigrants | Burma/Myanmar | 72.2 /100 | #149 | Good 4.6% |
| Immigrants | England | 70.5 /100 | #150 | Good 4.6% |
| Puget Sound Salish | 67.1 /100 | #151 | Good 4.6% |
| Pakistanis | 67.1 /100 | #152 | Good 4.6% |