South African vs Immigrants from Peru Female Unemployment
COMPARE
South African
Immigrants from Peru
Female Unemployment
Female Unemployment Comparison
South Africans
Immigrants from Peru
5.2%
FEMALE UNEMPLOYMENT
70.8/ 100
METRIC RATING
154th/ 347
METRIC RANK
5.5%
FEMALE UNEMPLOYMENT
5.9/ 100
METRIC RATING
226th/ 347
METRIC RANK
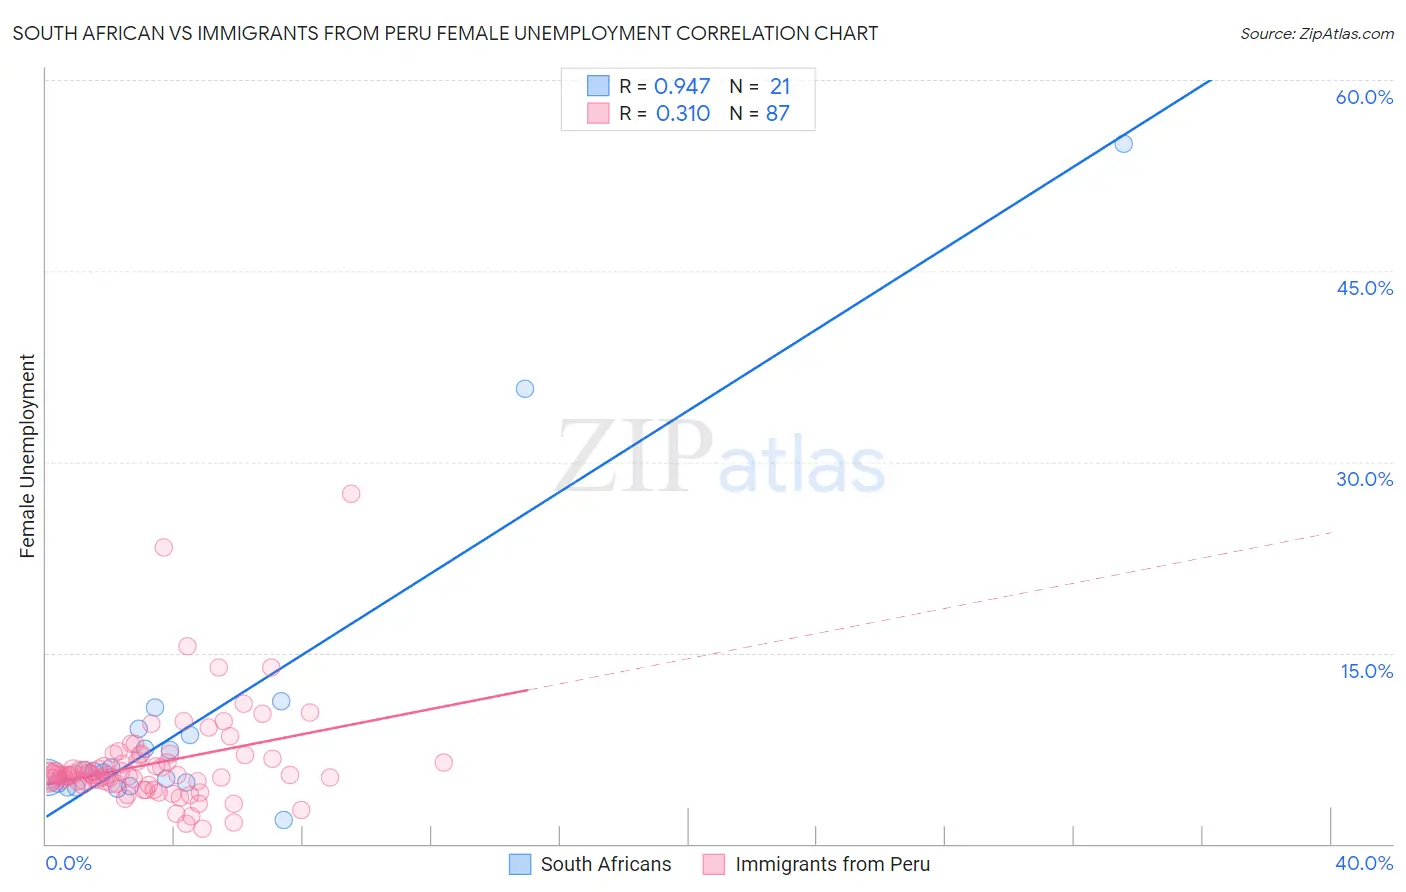
South African vs Immigrants from Peru Female Unemployment Correlation Chart
The statistical analysis conducted on geographies consisting of 182,288,157 people shows a near-perfect positive correlation between the proportion of South Africans and unemploymnet rate among females in the United States with a correlation coefficient (R) of 0.947 and weighted average of 5.2%. Similarly, the statistical analysis conducted on geographies consisting of 328,076,387 people shows a mild positive correlation between the proportion of Immigrants from Peru and unemploymnet rate among females in the United States with a correlation coefficient (R) of 0.310 and weighted average of 5.5%, a difference of 5.6%.
Female Unemployment Correlation Summary
| Measurement | South African | Immigrants from Peru |
| Minimum | 1.9% | 1.2% |
| Maximum | 55.0% | 27.5% |
| Range | 53.1% | 26.3% |
| Mean | 9.9% | 6.3% |
| Median | 5.7% | 5.4% |
| Interquartile 25% (IQ1) | 4.6% | 4.7% |
| Interquartile 75% (IQ3) | 8.8% | 6.7% |
| Interquartile Range (IQR) | 4.2% | 2.0% |
| Standard Deviation (Sample) | 12.4% | 3.9% |
| Standard Deviation (Population) | 12.1% | 3.8% |
Similar Demographics by Female Unemployment
Demographics Similar to South Africans by Female Unemployment
In terms of female unemployment, the demographic groups most similar to South Africans are Immigrants from Egypt (5.2%, a difference of 0.060%), Immigrants from Northern Africa (5.2%, a difference of 0.080%), Immigrants from Russia (5.2%, a difference of 0.10%), Albanian (5.2%, a difference of 0.18%), and Immigrants from Micronesia (5.2%, a difference of 0.27%).
| Demographics | Rating | Rank | Female Unemployment |
| Argentineans | 79.2 /100 | #147 | Good 5.2% |
| Immigrants | Argentina | 78.7 /100 | #148 | Good 5.2% |
| Asians | 78.3 /100 | #149 | Good 5.2% |
| Egyptians | 78.3 /100 | #150 | Good 5.2% |
| Immigrants | China | 75.9 /100 | #151 | Good 5.2% |
| Immigrants | Italy | 75.0 /100 | #152 | Good 5.2% |
| Immigrants | Greece | 74.9 /100 | #153 | Good 5.2% |
| South Africans | 70.8 /100 | #154 | Good 5.2% |
| Immigrants | Egypt | 70.0 /100 | #155 | Good 5.2% |
| Immigrants | Northern Africa | 69.6 /100 | #156 | Good 5.2% |
| Immigrants | Russia | 69.3 /100 | #157 | Good 5.2% |
| Albanians | 68.3 /100 | #158 | Good 5.2% |
| Immigrants | Micronesia | 66.9 /100 | #159 | Good 5.2% |
| Immigrants | Spain | 66.8 /100 | #160 | Good 5.2% |
| Immigrants | Pakistan | 66.7 /100 | #161 | Good 5.2% |
Demographics Similar to Immigrants from Peru by Female Unemployment
In terms of female unemployment, the demographic groups most similar to Immigrants from Peru are French American Indian (5.5%, a difference of 0.040%), Immigrants from Philippines (5.5%, a difference of 0.17%), Iraqi (5.5%, a difference of 0.27%), Delaware (5.5%, a difference of 0.30%), and Nicaraguan (5.5%, a difference of 0.31%).
| Demographics | Rating | Rank | Female Unemployment |
| South Americans | 8.6 /100 | #219 | Tragic 5.4% |
| Immigrants | Africa | 8.5 /100 | #220 | Tragic 5.4% |
| Brazilians | 7.3 /100 | #221 | Tragic 5.5% |
| Nicaraguans | 7.2 /100 | #222 | Tragic 5.5% |
| Delaware | 7.2 /100 | #223 | Tragic 5.5% |
| Iraqis | 7.1 /100 | #224 | Tragic 5.5% |
| French American Indians | 6.1 /100 | #225 | Tragic 5.5% |
| Immigrants | Peru | 5.9 /100 | #226 | Tragic 5.5% |
| Immigrants | Philippines | 5.3 /100 | #227 | Tragic 5.5% |
| Israelis | 4.8 /100 | #228 | Tragic 5.5% |
| Panamanians | 4.7 /100 | #229 | Tragic 5.5% |
| Immigrants | Uruguay | 4.7 /100 | #230 | Tragic 5.5% |
| Immigrants | Iraq | 3.9 /100 | #231 | Tragic 5.5% |
| Liberians | 3.9 /100 | #232 | Tragic 5.5% |
| Moroccans | 3.4 /100 | #233 | Tragic 5.5% |