South African vs Immigrants from Laos Female Unemployment
COMPARE
South African
Immigrants from Laos
Female Unemployment
Female Unemployment Comparison
South Africans
Immigrants from Laos
5.2%
FEMALE UNEMPLOYMENT
70.8/ 100
METRIC RATING
154th/ 347
METRIC RANK
5.3%
FEMALE UNEMPLOYMENT
47.5/ 100
METRIC RATING
175th/ 347
METRIC RANK
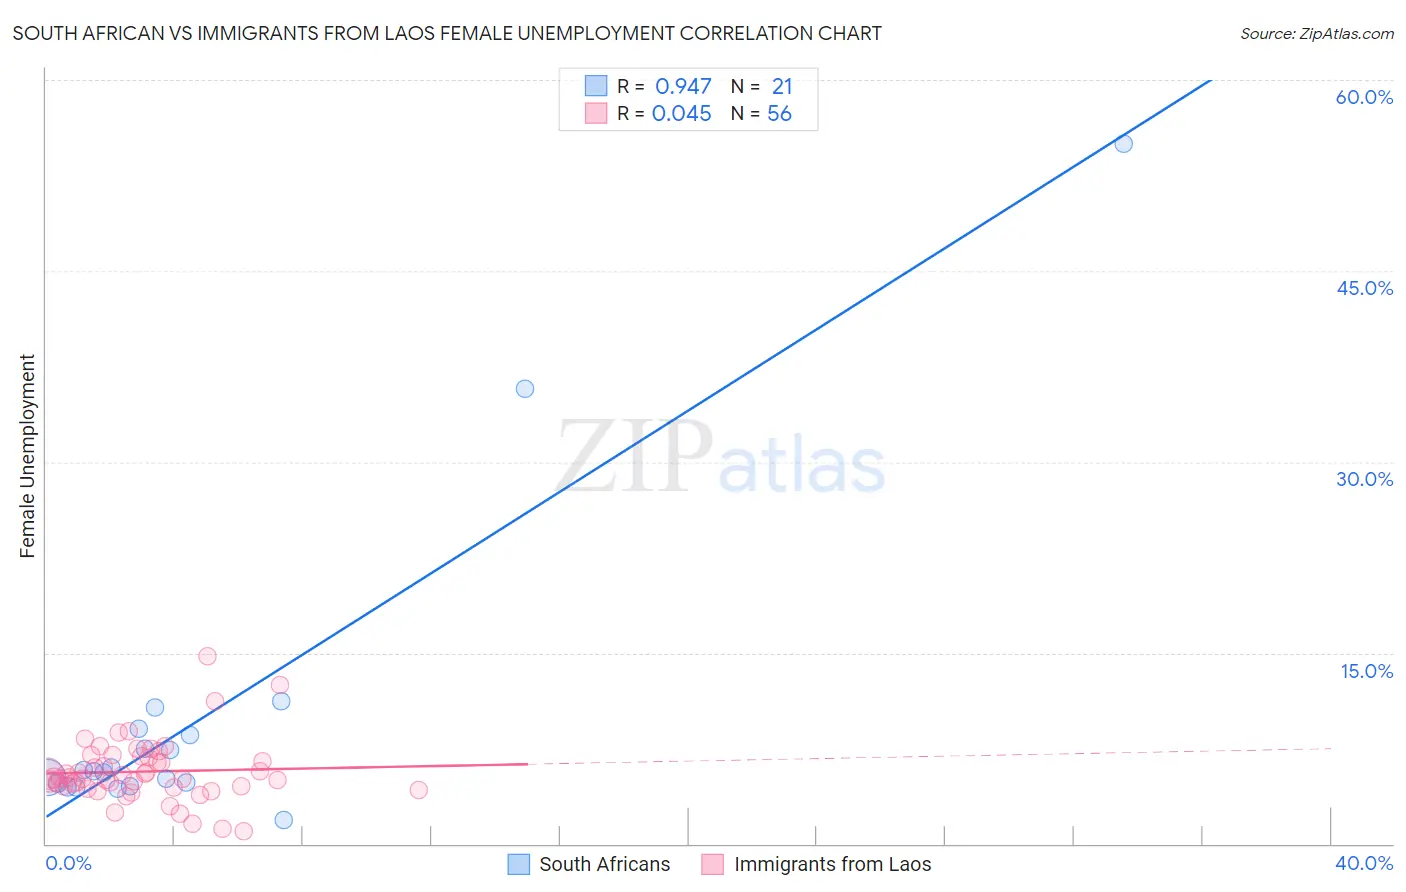
South African vs Immigrants from Laos Female Unemployment Correlation Chart
The statistical analysis conducted on geographies consisting of 182,288,157 people shows a near-perfect positive correlation between the proportion of South Africans and unemploymnet rate among females in the United States with a correlation coefficient (R) of 0.947 and weighted average of 5.2%. Similarly, the statistical analysis conducted on geographies consisting of 201,095,066 people shows no correlation between the proportion of Immigrants from Laos and unemploymnet rate among females in the United States with a correlation coefficient (R) of 0.045 and weighted average of 5.3%, a difference of 1.5%.
Female Unemployment Correlation Summary
| Measurement | South African | Immigrants from Laos |
| Minimum | 1.9% | 1.0% |
| Maximum | 55.0% | 14.7% |
| Range | 53.1% | 13.7% |
| Mean | 9.9% | 5.7% |
| Median | 5.7% | 5.2% |
| Interquartile 25% (IQ1) | 4.6% | 4.4% |
| Interquartile 75% (IQ3) | 8.8% | 6.8% |
| Interquartile Range (IQR) | 4.2% | 2.4% |
| Standard Deviation (Sample) | 12.4% | 2.4% |
| Standard Deviation (Population) | 12.1% | 2.4% |
Similar Demographics by Female Unemployment
Demographics Similar to South Africans by Female Unemployment
In terms of female unemployment, the demographic groups most similar to South Africans are Immigrants from Egypt (5.2%, a difference of 0.060%), Immigrants from Northern Africa (5.2%, a difference of 0.080%), Immigrants from Russia (5.2%, a difference of 0.10%), Albanian (5.2%, a difference of 0.18%), and Immigrants from Micronesia (5.2%, a difference of 0.27%).
| Demographics | Rating | Rank | Female Unemployment |
| Argentineans | 79.2 /100 | #147 | Good 5.2% |
| Immigrants | Argentina | 78.7 /100 | #148 | Good 5.2% |
| Asians | 78.3 /100 | #149 | Good 5.2% |
| Egyptians | 78.3 /100 | #150 | Good 5.2% |
| Immigrants | China | 75.9 /100 | #151 | Good 5.2% |
| Immigrants | Italy | 75.0 /100 | #152 | Good 5.2% |
| Immigrants | Greece | 74.9 /100 | #153 | Good 5.2% |
| South Africans | 70.8 /100 | #154 | Good 5.2% |
| Immigrants | Egypt | 70.0 /100 | #155 | Good 5.2% |
| Immigrants | Northern Africa | 69.6 /100 | #156 | Good 5.2% |
| Immigrants | Russia | 69.3 /100 | #157 | Good 5.2% |
| Albanians | 68.3 /100 | #158 | Good 5.2% |
| Immigrants | Micronesia | 66.9 /100 | #159 | Good 5.2% |
| Immigrants | Spain | 66.8 /100 | #160 | Good 5.2% |
| Immigrants | Pakistan | 66.7 /100 | #161 | Good 5.2% |
Demographics Similar to Immigrants from Laos by Female Unemployment
In terms of female unemployment, the demographic groups most similar to Immigrants from Laos are Immigrants from Vietnam (5.3%, a difference of 0.0%), Immigrants from Morocco (5.3%, a difference of 0.010%), Immigrants from Southern Europe (5.3%, a difference of 0.080%), Immigrants from Poland (5.3%, a difference of 0.15%), and Laotian (5.3%, a difference of 0.15%).
| Demographics | Rating | Rank | Female Unemployment |
| Sri Lankans | 59.4 /100 | #168 | Average 5.2% |
| Immigrants | Chile | 59.0 /100 | #169 | Average 5.2% |
| Spanish | 55.9 /100 | #170 | Average 5.2% |
| Immigrants | Denmark | 55.0 /100 | #171 | Average 5.2% |
| Immigrants | Uganda | 50.7 /100 | #172 | Average 5.3% |
| Iranians | 50.4 /100 | #173 | Average 5.3% |
| Immigrants | Poland | 50.0 /100 | #174 | Average 5.3% |
| Immigrants | Laos | 47.5 /100 | #175 | Average 5.3% |
| Immigrants | Vietnam | 47.5 /100 | #176 | Average 5.3% |
| Immigrants | Morocco | 47.4 /100 | #177 | Average 5.3% |
| Immigrants | Southern Europe | 46.2 /100 | #178 | Average 5.3% |
| Laotians | 45.1 /100 | #179 | Average 5.3% |
| Immigrants | Congo | 43.1 /100 | #180 | Average 5.3% |
| Taiwanese | 42.7 /100 | #181 | Average 5.3% |
| Immigrants | Nonimmigrants | 42.6 /100 | #182 | Average 5.3% |