Somali vs Mexican American Indian Male Unemployment
COMPARE
Somali
Mexican American Indian
Male Unemployment
Male Unemployment Comparison
Somalis
Mexican American Indians
5.6%
MALE UNEMPLOYMENT
1.5/ 100
METRIC RATING
233rd/ 347
METRIC RANK
5.8%
MALE UNEMPLOYMENT
0.2/ 100
METRIC RATING
253rd/ 347
METRIC RANK
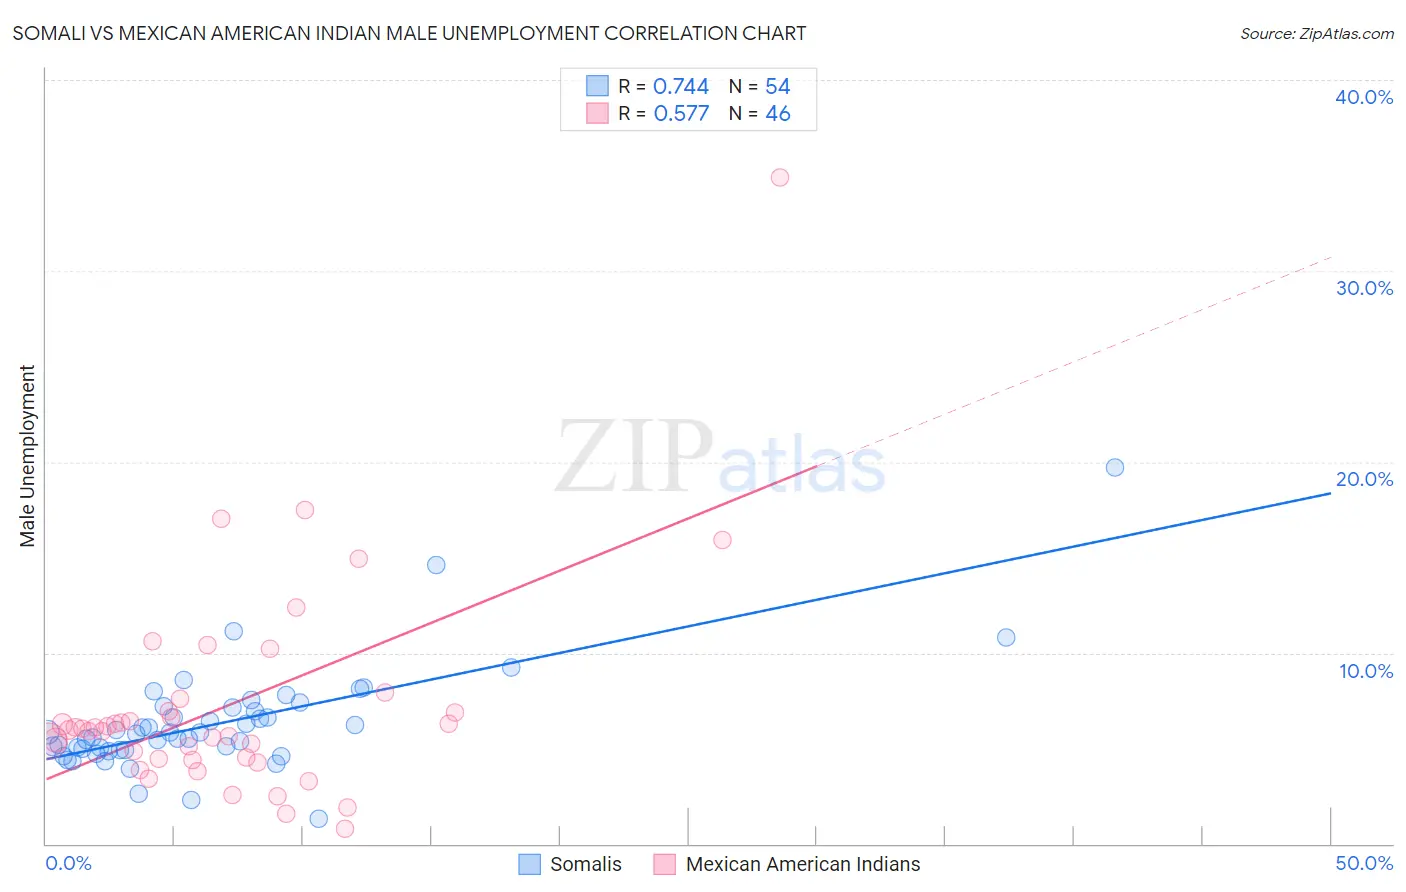
Somali vs Mexican American Indian Male Unemployment Correlation Chart
The statistical analysis conducted on geographies consisting of 99,217,448 people shows a strong positive correlation between the proportion of Somalis and unemployment rate among males in the United States with a correlation coefficient (R) of 0.744 and weighted average of 5.6%. Similarly, the statistical analysis conducted on geographies consisting of 316,861,577 people shows a substantial positive correlation between the proportion of Mexican American Indians and unemployment rate among males in the United States with a correlation coefficient (R) of 0.577 and weighted average of 5.8%, a difference of 2.8%.
Male Unemployment Correlation Summary
| Measurement | Somali | Mexican American Indian |
| Minimum | 1.3% | 0.80% |
| Maximum | 19.7% | 34.9% |
| Range | 18.4% | 34.1% |
| Mean | 6.3% | 7.2% |
| Median | 5.8% | 6.0% |
| Interquartile 25% (IQ1) | 4.9% | 4.4% |
| Interquartile 75% (IQ3) | 7.1% | 6.9% |
| Interquartile Range (IQR) | 2.2% | 2.5% |
| Standard Deviation (Sample) | 2.8% | 5.6% |
| Standard Deviation (Population) | 2.8% | 5.6% |
Demographics Similar to Somalis and Mexican American Indians by Male Unemployment
In terms of male unemployment, the demographic groups most similar to Somalis are Immigrants from Somalia (5.6%, a difference of 0.0%), Immigrants from Honduras (5.6%, a difference of 0.030%), Guatemalan (5.6%, a difference of 0.35%), Honduran (5.6%, a difference of 0.44%), and Native Hawaiian (5.6%, a difference of 0.48%). Similarly, the demographic groups most similar to Mexican American Indians are Mexican (5.8%, a difference of 0.13%), Spanish American (5.7%, a difference of 0.71%), Immigrants from Bahamas (5.7%, a difference of 0.75%), Cree (5.7%, a difference of 1.0%), and Marshallese (5.7%, a difference of 1.1%).
| Demographics | Rating | Rank | Male Unemployment |
| Somalis | 1.5 /100 | #233 | Tragic 5.6% |
| Immigrants | Somalia | 1.5 /100 | #234 | Tragic 5.6% |
| Immigrants | Honduras | 1.5 /100 | #235 | Tragic 5.6% |
| Guatemalans | 1.2 /100 | #236 | Tragic 5.6% |
| Hondurans | 1.1 /100 | #237 | Tragic 5.6% |
| Native Hawaiians | 1.1 /100 | #238 | Tragic 5.6% |
| Immigrants | Guatemala | 1.1 /100 | #239 | Tragic 5.6% |
| Immigrants | Cameroon | 1.0 /100 | #240 | Tragic 5.6% |
| Salvadorans | 1.0 /100 | #241 | Tragic 5.7% |
| Ottawa | 0.9 /100 | #242 | Tragic 5.7% |
| Bangladeshis | 0.8 /100 | #243 | Tragic 5.7% |
| Immigrants | El Salvador | 0.7 /100 | #244 | Tragic 5.7% |
| Yaqui | 0.7 /100 | #245 | Tragic 5.7% |
| Iroquois | 0.6 /100 | #246 | Tragic 5.7% |
| Hawaiians | 0.6 /100 | #247 | Tragic 5.7% |
| Marshallese | 0.5 /100 | #248 | Tragic 5.7% |
| Cree | 0.4 /100 | #249 | Tragic 5.7% |
| Immigrants | Bahamas | 0.4 /100 | #250 | Tragic 5.7% |
| Spanish Americans | 0.3 /100 | #251 | Tragic 5.7% |
| Mexicans | 0.2 /100 | #252 | Tragic 5.8% |
| Mexican American Indians | 0.2 /100 | #253 | Tragic 5.8% |