Somali vs Immigrants from Norway Male Unemployment
COMPARE
Somali
Immigrants from Norway
Male Unemployment
Male Unemployment Comparison
Somalis
Immigrants from Norway
5.6%
MALE UNEMPLOYMENT
1.5/ 100
METRIC RATING
233rd/ 347
METRIC RANK
5.2%
MALE UNEMPLOYMENT
71.0/ 100
METRIC RATING
160th/ 347
METRIC RANK
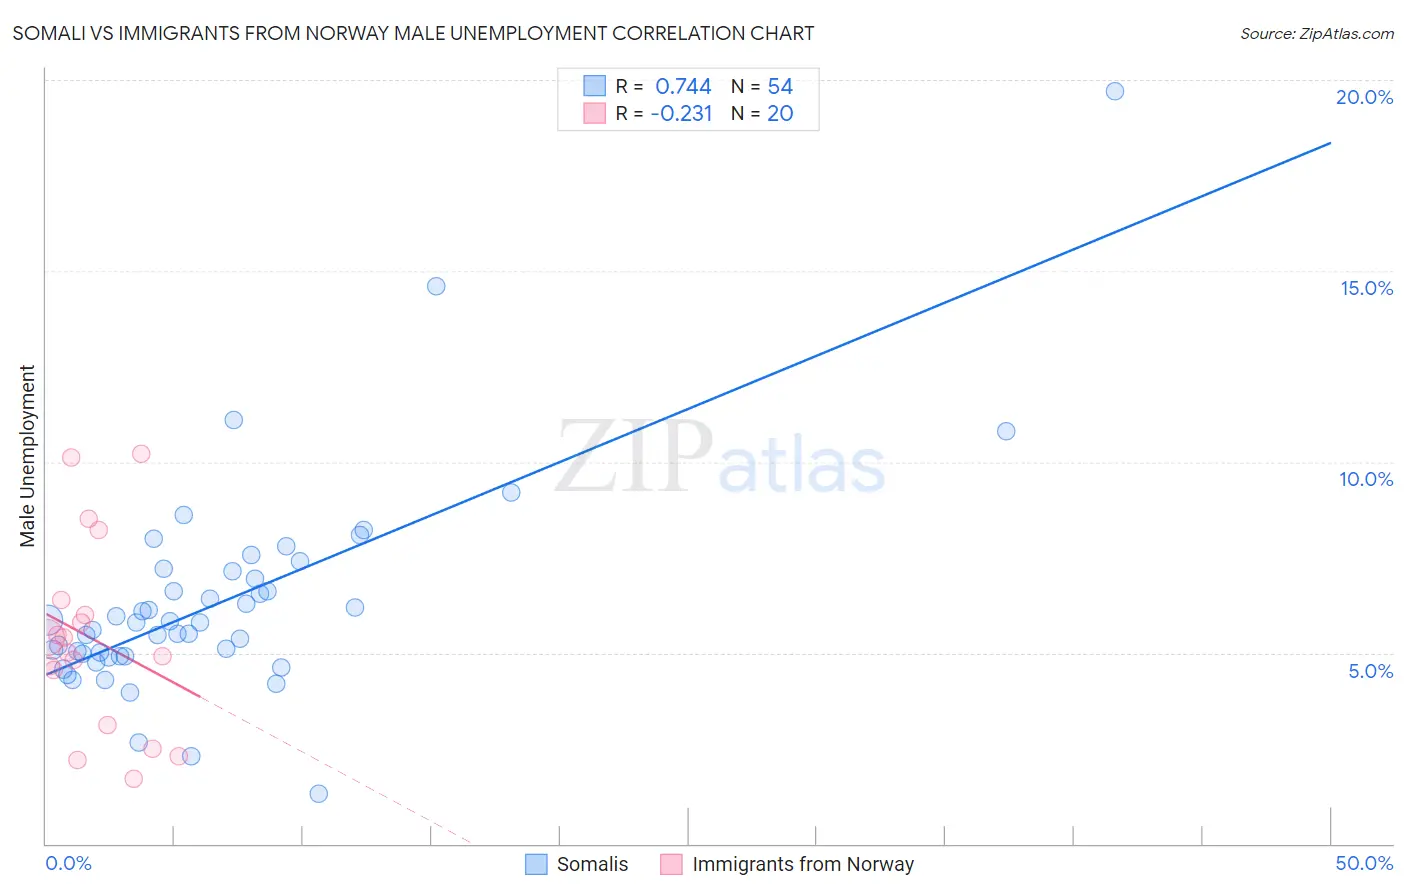
Somali vs Immigrants from Norway Male Unemployment Correlation Chart
The statistical analysis conducted on geographies consisting of 99,217,448 people shows a strong positive correlation between the proportion of Somalis and unemployment rate among males in the United States with a correlation coefficient (R) of 0.744 and weighted average of 5.6%. Similarly, the statistical analysis conducted on geographies consisting of 116,545,854 people shows a weak negative correlation between the proportion of Immigrants from Norway and unemployment rate among males in the United States with a correlation coefficient (R) of -0.231 and weighted average of 5.2%, a difference of 7.5%.
Male Unemployment Correlation Summary
| Measurement | Somali | Immigrants from Norway |
| Minimum | 1.3% | 1.7% |
| Maximum | 19.7% | 10.2% |
| Range | 18.4% | 8.5% |
| Mean | 6.3% | 5.4% |
| Median | 5.8% | 5.2% |
| Interquartile 25% (IQ1) | 4.9% | 3.8% |
| Interquartile 75% (IQ3) | 7.1% | 6.2% |
| Interquartile Range (IQR) | 2.2% | 2.4% |
| Standard Deviation (Sample) | 2.8% | 2.4% |
| Standard Deviation (Population) | 2.8% | 2.4% |
Similar Demographics by Male Unemployment
Demographics Similar to Somalis by Male Unemployment
In terms of male unemployment, the demographic groups most similar to Somalis are Immigrants from Somalia (5.6%, a difference of 0.0%), Immigrants from Honduras (5.6%, a difference of 0.030%), Moroccan (5.6%, a difference of 0.080%), Choctaw (5.6%, a difference of 0.11%), and Immigrants from Africa (5.6%, a difference of 0.16%).
| Demographics | Rating | Rank | Male Unemployment |
| Immigrants | Cambodia | 1.8 /100 | #226 | Tragic 5.6% |
| Immigrants | Panama | 1.8 /100 | #227 | Tragic 5.6% |
| Seminole | 1.8 /100 | #228 | Tragic 5.6% |
| Central Americans | 1.8 /100 | #229 | Tragic 5.6% |
| Immigrants | Africa | 1.7 /100 | #230 | Tragic 5.6% |
| Choctaw | 1.6 /100 | #231 | Tragic 5.6% |
| Moroccans | 1.6 /100 | #232 | Tragic 5.6% |
| Somalis | 1.5 /100 | #233 | Tragic 5.6% |
| Immigrants | Somalia | 1.5 /100 | #234 | Tragic 5.6% |
| Immigrants | Honduras | 1.5 /100 | #235 | Tragic 5.6% |
| Guatemalans | 1.2 /100 | #236 | Tragic 5.6% |
| Hondurans | 1.1 /100 | #237 | Tragic 5.6% |
| Native Hawaiians | 1.1 /100 | #238 | Tragic 5.6% |
| Immigrants | Guatemala | 1.1 /100 | #239 | Tragic 5.6% |
| Immigrants | Cameroon | 1.0 /100 | #240 | Tragic 5.6% |
Demographics Similar to Immigrants from Norway by Male Unemployment
In terms of male unemployment, the demographic groups most similar to Immigrants from Norway are Indonesian (5.2%, a difference of 0.010%), Immigrants from China (5.2%, a difference of 0.030%), Immigrants from Indonesia (5.2%, a difference of 0.040%), Immigrants from Northern Africa (5.2%, a difference of 0.090%), and American (5.2%, a difference of 0.12%).
| Demographics | Rating | Rank | Male Unemployment |
| Immigrants | Uruguay | 73.9 /100 | #153 | Good 5.2% |
| Laotians | 73.8 /100 | #154 | Good 5.2% |
| Immigrants | Hungary | 73.4 /100 | #155 | Good 5.2% |
| Americans | 72.7 /100 | #156 | Good 5.2% |
| Immigrants | Northern Africa | 72.3 /100 | #157 | Good 5.2% |
| Immigrants | Indonesia | 71.5 /100 | #158 | Good 5.2% |
| Indonesians | 71.2 /100 | #159 | Good 5.2% |
| Immigrants | Norway | 71.0 /100 | #160 | Good 5.2% |
| Immigrants | China | 70.6 /100 | #161 | Good 5.2% |
| Immigrants | Egypt | 65.9 /100 | #162 | Good 5.2% |
| Immigrants | Hong Kong | 65.7 /100 | #163 | Good 5.2% |
| Afghans | 62.0 /100 | #164 | Good 5.3% |
| South Americans | 60.6 /100 | #165 | Good 5.3% |
| Immigrants | Morocco | 60.2 /100 | #166 | Good 5.3% |
| Immigrants | Vietnam | 58.1 /100 | #167 | Average 5.3% |