Somali vs Pima Male Unemployment
COMPARE
Somali
Pima
Male Unemployment
Male Unemployment Comparison
Somalis
Pima
5.6%
MALE UNEMPLOYMENT
1.5/ 100
METRIC RATING
233rd/ 347
METRIC RANK
8.3%
MALE UNEMPLOYMENT
0.0/ 100
METRIC RATING
332nd/ 347
METRIC RANK
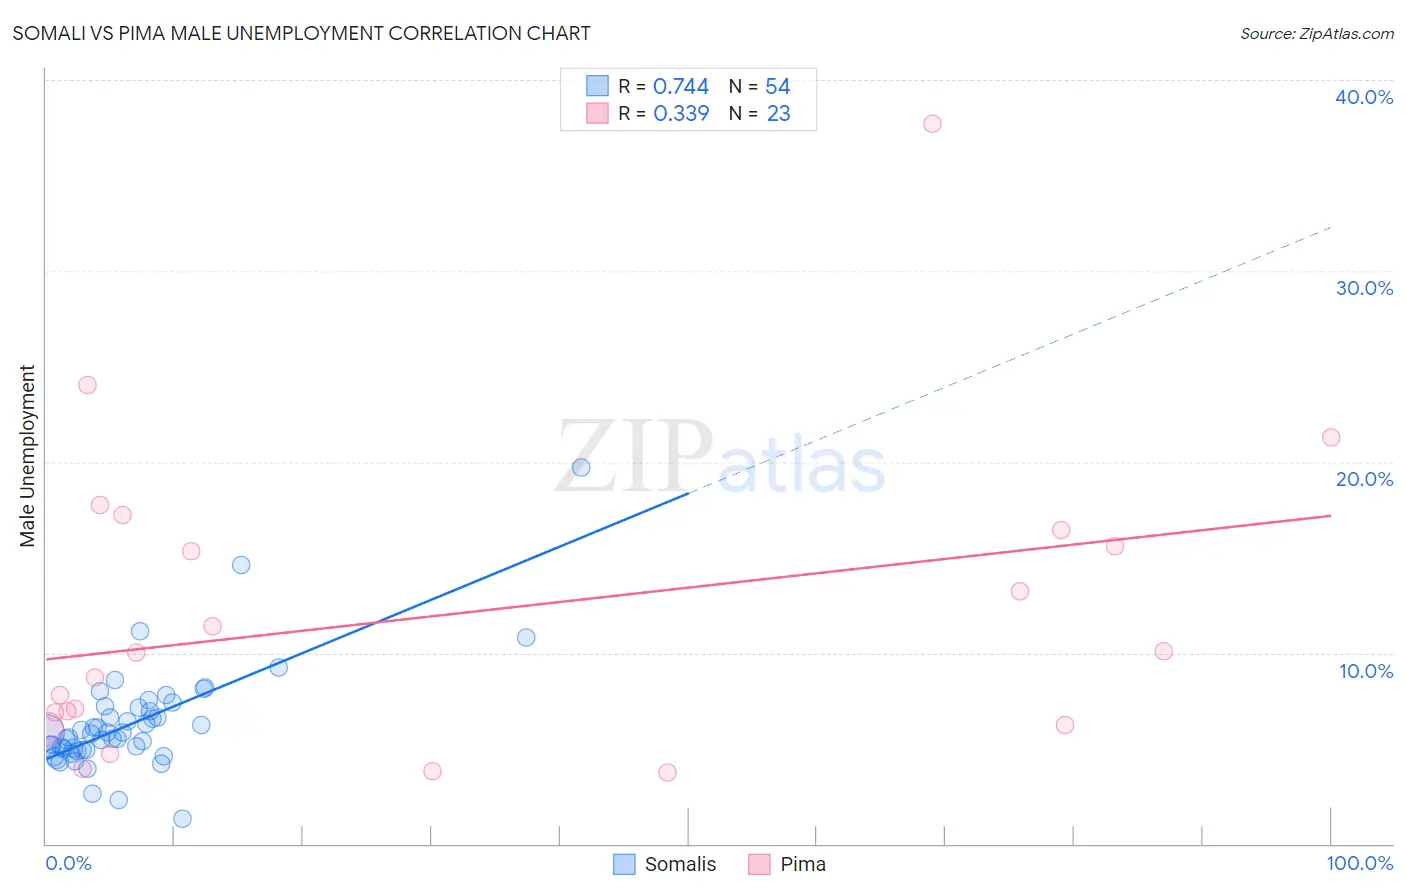
Somali vs Pima Male Unemployment Correlation Chart
The statistical analysis conducted on geographies consisting of 99,217,448 people shows a strong positive correlation between the proportion of Somalis and unemployment rate among males in the United States with a correlation coefficient (R) of 0.744 and weighted average of 5.6%. Similarly, the statistical analysis conducted on geographies consisting of 61,468,646 people shows a mild positive correlation between the proportion of Pima and unemployment rate among males in the United States with a correlation coefficient (R) of 0.339 and weighted average of 8.3%, a difference of 47.3%.
Male Unemployment Correlation Summary
| Measurement | Somali | Pima |
| Minimum | 1.3% | 3.7% |
| Maximum | 19.7% | 37.7% |
| Range | 18.4% | 34.0% |
| Mean | 6.3% | 12.0% |
| Median | 5.8% | 10.0% |
| Interquartile 25% (IQ1) | 4.9% | 6.2% |
| Interquartile 75% (IQ3) | 7.1% | 16.4% |
| Interquartile Range (IQR) | 2.2% | 10.2% |
| Standard Deviation (Sample) | 2.8% | 8.1% |
| Standard Deviation (Population) | 2.8% | 7.9% |
Similar Demographics by Male Unemployment
Demographics Similar to Somalis by Male Unemployment
In terms of male unemployment, the demographic groups most similar to Somalis are Immigrants from Somalia (5.6%, a difference of 0.0%), Immigrants from Honduras (5.6%, a difference of 0.030%), Moroccan (5.6%, a difference of 0.080%), Choctaw (5.6%, a difference of 0.11%), and Immigrants from Africa (5.6%, a difference of 0.16%).
| Demographics | Rating | Rank | Male Unemployment |
| Immigrants | Cambodia | 1.8 /100 | #226 | Tragic 5.6% |
| Immigrants | Panama | 1.8 /100 | #227 | Tragic 5.6% |
| Seminole | 1.8 /100 | #228 | Tragic 5.6% |
| Central Americans | 1.8 /100 | #229 | Tragic 5.6% |
| Immigrants | Africa | 1.7 /100 | #230 | Tragic 5.6% |
| Choctaw | 1.6 /100 | #231 | Tragic 5.6% |
| Moroccans | 1.6 /100 | #232 | Tragic 5.6% |
| Somalis | 1.5 /100 | #233 | Tragic 5.6% |
| Immigrants | Somalia | 1.5 /100 | #234 | Tragic 5.6% |
| Immigrants | Honduras | 1.5 /100 | #235 | Tragic 5.6% |
| Guatemalans | 1.2 /100 | #236 | Tragic 5.6% |
| Hondurans | 1.1 /100 | #237 | Tragic 5.6% |
| Native Hawaiians | 1.1 /100 | #238 | Tragic 5.6% |
| Immigrants | Guatemala | 1.1 /100 | #239 | Tragic 5.6% |
| Immigrants | Cameroon | 1.0 /100 | #240 | Tragic 5.6% |
Demographics Similar to Pima by Male Unemployment
In terms of male unemployment, the demographic groups most similar to Pima are Sioux (8.4%, a difference of 1.3%), Tsimshian (8.5%, a difference of 2.3%), Alaska Native (8.1%, a difference of 2.4%), Pueblo (8.5%, a difference of 2.4%), and Yuman (8.6%, a difference of 3.8%).
| Demographics | Rating | Rank | Male Unemployment |
| Shoshone | 0.0 /100 | #325 | Tragic 7.6% |
| Immigrants | Dominican Republic | 0.0 /100 | #326 | Tragic 7.6% |
| Paiute | 0.0 /100 | #327 | Tragic 7.7% |
| Natives/Alaskans | 0.0 /100 | #328 | Tragic 7.7% |
| Immigrants | Yemen | 0.0 /100 | #329 | Tragic 7.8% |
| Yakama | 0.0 /100 | #330 | Tragic 7.9% |
| Alaska Natives | 0.0 /100 | #331 | Tragic 8.1% |
| Pima | 0.0 /100 | #332 | Tragic 8.3% |
| Sioux | 0.0 /100 | #333 | Tragic 8.4% |
| Tsimshian | 0.0 /100 | #334 | Tragic 8.5% |
| Pueblo | 0.0 /100 | #335 | Tragic 8.5% |
| Yuman | 0.0 /100 | #336 | Tragic 8.6% |
| Puerto Ricans | 0.0 /100 | #337 | Tragic 8.6% |
| Apache | 0.0 /100 | #338 | Tragic 8.6% |
| Cheyenne | 0.0 /100 | #339 | Tragic 9.8% |