Somali vs Mexican American Indian Unemployment Among Ages 55 to 59 years
COMPARE
Somali
Mexican American Indian
Unemployment Among Ages 55 to 59 years
Unemployment Among Ages 55 to 59 years Comparison
Somalis
Mexican American Indians
4.4%
UNEMPLOYMENT AMONG AGES 55 TO 59 YEARS
100.0/ 100
METRIC RATING
16th/ 347
METRIC RANK
5.2%
UNEMPLOYMENT AMONG AGES 55 TO 59 YEARS
0.0/ 100
METRIC RATING
274th/ 347
METRIC RANK
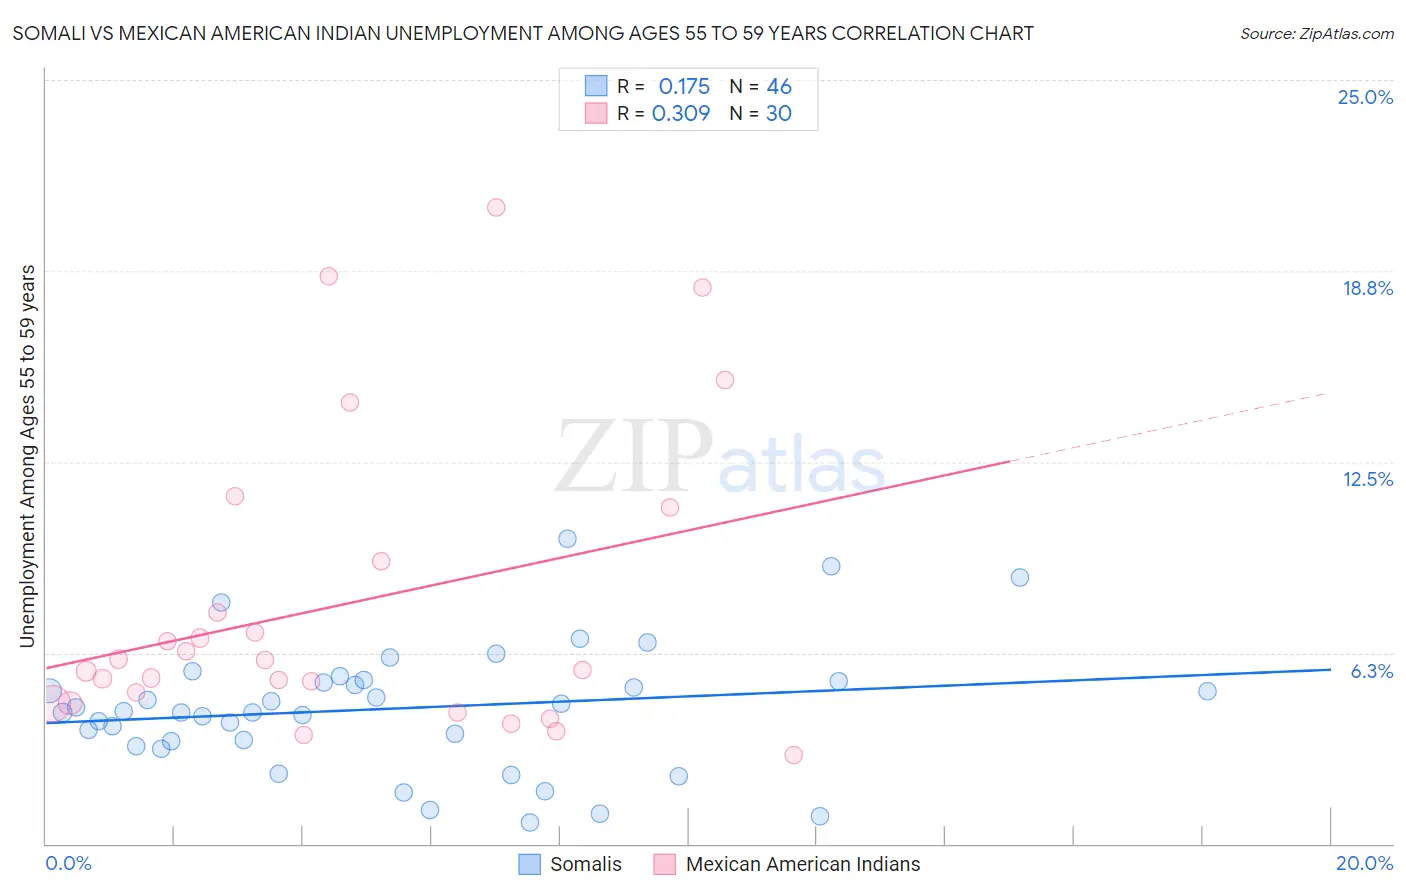
Somali vs Mexican American Indian Unemployment Among Ages 55 to 59 years Correlation Chart
The statistical analysis conducted on geographies consisting of 97,150,255 people shows a poor positive correlation between the proportion of Somalis and unemployment rate among population between the ages 55 and 59 in the United States with a correlation coefficient (R) of 0.175 and weighted average of 4.4%. Similarly, the statistical analysis conducted on geographies consisting of 299,499,153 people shows a mild positive correlation between the proportion of Mexican American Indians and unemployment rate among population between the ages 55 and 59 in the United States with a correlation coefficient (R) of 0.309 and weighted average of 5.2%, a difference of 19.9%.
Unemployment Among Ages 55 to 59 years Correlation Summary
| Measurement | Somali | Mexican American Indian |
| Minimum | 0.70% | 2.9% |
| Maximum | 10.0% | 20.8% |
| Range | 9.3% | 17.9% |
| Mean | 4.4% | 7.8% |
| Median | 4.3% | 5.9% |
| Interquartile 25% (IQ1) | 3.4% | 4.6% |
| Interquartile 75% (IQ3) | 5.3% | 9.2% |
| Interquartile Range (IQR) | 1.9% | 4.6% |
| Standard Deviation (Sample) | 2.1% | 4.9% |
| Standard Deviation (Population) | 2.0% | 4.8% |
Similar Demographics by Unemployment Among Ages 55 to 59 years
Demographics Similar to Somalis by Unemployment Among Ages 55 to 59 years
In terms of unemployment among ages 55 to 59 years, the demographic groups most similar to Somalis are Bulgarian (4.3%, a difference of 0.23%), Czech (4.4%, a difference of 0.35%), Immigrants from India (4.3%, a difference of 0.49%), Indonesian (4.3%, a difference of 0.65%), and Danish (4.3%, a difference of 0.90%).
| Demographics | Rating | Rank | Unemployment Among Ages 55 to 59 years |
| Cubans | 100.0 /100 | #9 | Exceptional 4.2% |
| Tongans | 100.0 /100 | #10 | Exceptional 4.3% |
| Immigrants | Congo | 100.0 /100 | #11 | Exceptional 4.3% |
| Danes | 100.0 /100 | #12 | Exceptional 4.3% |
| Indonesians | 100.0 /100 | #13 | Exceptional 4.3% |
| Immigrants | India | 100.0 /100 | #14 | Exceptional 4.3% |
| Bulgarians | 100.0 /100 | #15 | Exceptional 4.3% |
| Somalis | 100.0 /100 | #16 | Exceptional 4.4% |
| Czechs | 100.0 /100 | #17 | Exceptional 4.4% |
| Immigrants | Somalia | 100.0 /100 | #18 | Exceptional 4.4% |
| Chinese | 100.0 /100 | #19 | Exceptional 4.4% |
| Swedes | 100.0 /100 | #20 | Exceptional 4.4% |
| Puget Sound Salish | 100.0 /100 | #21 | Exceptional 4.4% |
| Immigrants | Burma/Myanmar | 100.0 /100 | #22 | Exceptional 4.4% |
| Kenyans | 100.0 /100 | #23 | Exceptional 4.4% |
Demographics Similar to Mexican American Indians by Unemployment Among Ages 55 to 59 years
In terms of unemployment among ages 55 to 59 years, the demographic groups most similar to Mexican American Indians are Israeli (5.2%, a difference of 0.10%), West Indian (5.2%, a difference of 0.11%), Ottawa (5.2%, a difference of 0.12%), Immigrants from Latin America (5.2%, a difference of 0.23%), and Immigrants from Jamaica (5.2%, a difference of 0.35%).
| Demographics | Rating | Rank | Unemployment Among Ages 55 to 59 years |
| Immigrants | Senegal | 0.1 /100 | #267 | Tragic 5.2% |
| Mexicans | 0.1 /100 | #268 | Tragic 5.2% |
| Tsimshian | 0.1 /100 | #269 | Tragic 5.2% |
| Ute | 0.1 /100 | #270 | Tragic 5.2% |
| Cree | 0.1 /100 | #271 | Tragic 5.2% |
| Immigrants | Jamaica | 0.0 /100 | #272 | Tragic 5.2% |
| Ottawa | 0.0 /100 | #273 | Tragic 5.2% |
| Mexican American Indians | 0.0 /100 | #274 | Tragic 5.2% |
| Israelis | 0.0 /100 | #275 | Tragic 5.2% |
| West Indians | 0.0 /100 | #276 | Tragic 5.2% |
| Immigrants | Latin America | 0.0 /100 | #277 | Tragic 5.2% |
| Immigrants | Barbados | 0.0 /100 | #278 | Tragic 5.2% |
| Alsatians | 0.0 /100 | #279 | Tragic 5.2% |
| Immigrants | Uzbekistan | 0.0 /100 | #280 | Tragic 5.3% |
| Guatemalans | 0.0 /100 | #281 | Tragic 5.3% |