Immigrants from Bahamas vs Salvadoran Unemployment
COMPARE
Immigrants from Bahamas
Salvadoran
Unemployment
Unemployment Comparison
Immigrants from Bahamas
Salvadorans
5.8%
UNEMPLOYMENT
0.1/ 100
METRIC RATING
258th/ 347
METRIC RANK
5.8%
UNEMPLOYMENT
0.1/ 100
METRIC RATING
263rd/ 347
METRIC RANK
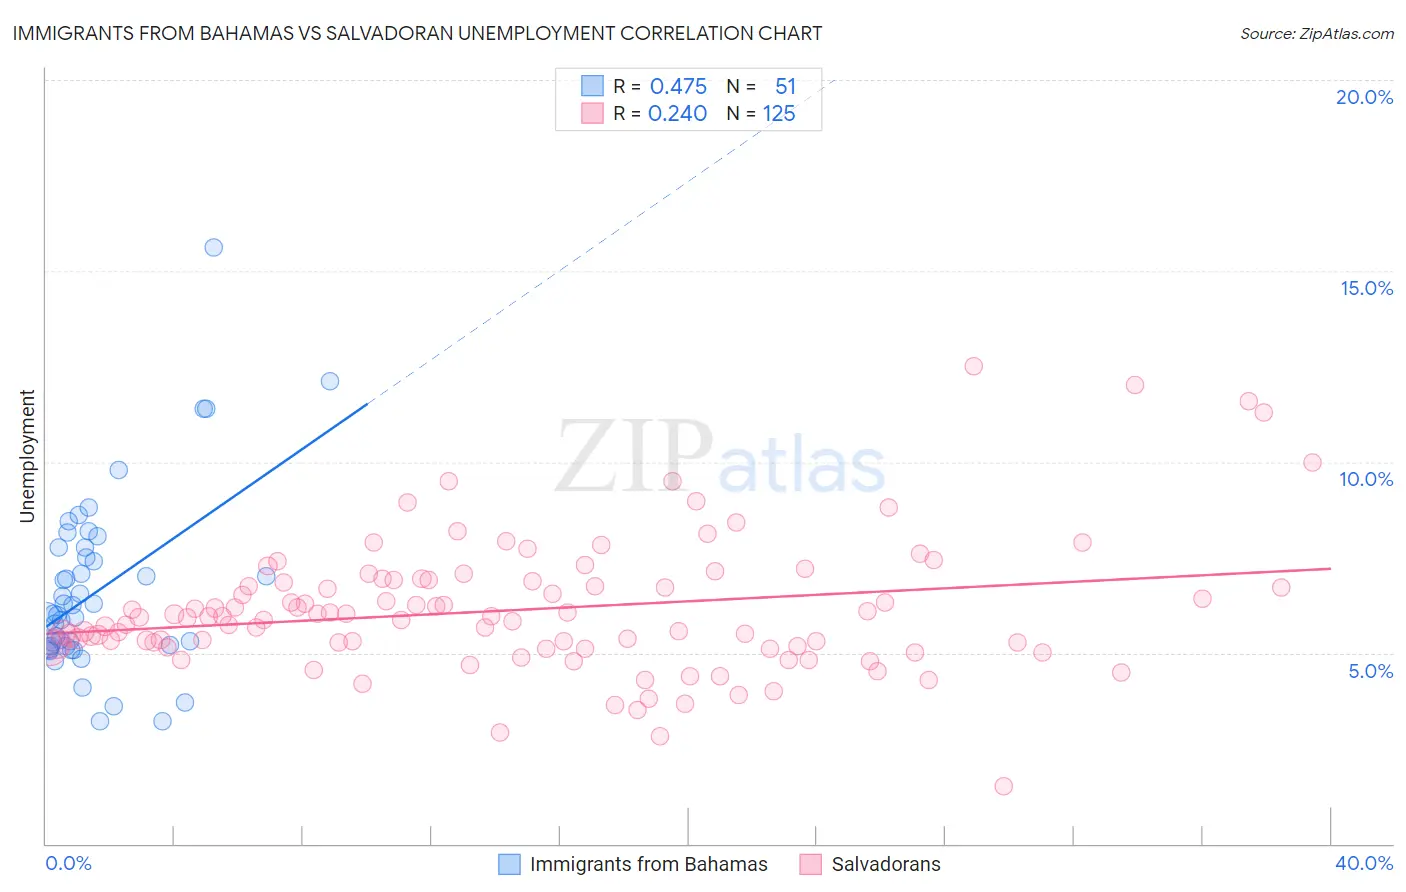
Immigrants from Bahamas vs Salvadoran Unemployment Correlation Chart
The statistical analysis conducted on geographies consisting of 104,648,051 people shows a moderate positive correlation between the proportion of Immigrants from Bahamas and unemployment in the United States with a correlation coefficient (R) of 0.475 and weighted average of 5.8%. Similarly, the statistical analysis conducted on geographies consisting of 398,590,772 people shows a weak positive correlation between the proportion of Salvadorans and unemployment in the United States with a correlation coefficient (R) of 0.240 and weighted average of 5.8%, a difference of 0.29%.
Unemployment Correlation Summary
| Measurement | Immigrants from Bahamas | Salvadoran |
| Minimum | 3.2% | 1.5% |
| Maximum | 15.6% | 12.5% |
| Range | 12.4% | 11.0% |
| Mean | 6.6% | 6.1% |
| Median | 6.0% | 5.9% |
| Interquartile 25% (IQ1) | 5.2% | 5.2% |
| Interquartile 75% (IQ3) | 7.8% | 6.9% |
| Interquartile Range (IQR) | 2.6% | 1.7% |
| Standard Deviation (Sample) | 2.3% | 1.7% |
| Standard Deviation (Population) | 2.3% | 1.7% |
Demographics Similar to Immigrants from Bahamas and Salvadorans by Unemployment
In terms of unemployment, the demographic groups most similar to Immigrants from Bahamas are Subsaharan African (5.8%, a difference of 0.12%), Yaqui (5.8%, a difference of 0.14%), Immigrants from Uzbekistan (5.8%, a difference of 0.14%), Immigrants from Guatemala (5.8%, a difference of 0.16%), and Sierra Leonean (5.8%, a difference of 0.26%). Similarly, the demographic groups most similar to Salvadorans are Sierra Leonean (5.8%, a difference of 0.030%), Immigrants from Liberia (5.8%, a difference of 0.090%), Immigrants from Guatemala (5.8%, a difference of 0.13%), Immigrants from Uzbekistan (5.8%, a difference of 0.15%), and Nigerian (5.8%, a difference of 0.16%).
| Demographics | Rating | Rank | Unemployment |
| Japanese | 0.8 /100 | #250 | Tragic 5.6% |
| Kiowa | 0.6 /100 | #251 | Tragic 5.7% |
| Hondurans | 0.3 /100 | #252 | Tragic 5.7% |
| Central Americans | 0.3 /100 | #253 | Tragic 5.7% |
| Immigrants | Honduras | 0.3 /100 | #254 | Tragic 5.7% |
| Immigrants | Portugal | 0.2 /100 | #255 | Tragic 5.7% |
| Guatemalans | 0.2 /100 | #256 | Tragic 5.8% |
| Yaqui | 0.2 /100 | #257 | Tragic 5.8% |
| Immigrants | Bahamas | 0.1 /100 | #258 | Tragic 5.8% |
| Sub-Saharan Africans | 0.1 /100 | #259 | Tragic 5.8% |
| Immigrants | Uzbekistan | 0.1 /100 | #260 | Tragic 5.8% |
| Immigrants | Guatemala | 0.1 /100 | #261 | Tragic 5.8% |
| Sierra Leoneans | 0.1 /100 | #262 | Tragic 5.8% |
| Salvadorans | 0.1 /100 | #263 | Tragic 5.8% |
| Immigrants | Liberia | 0.1 /100 | #264 | Tragic 5.8% |
| Nigerians | 0.1 /100 | #265 | Tragic 5.8% |
| Mexican American Indians | 0.1 /100 | #266 | Tragic 5.8% |
| Immigrants | Nigeria | 0.1 /100 | #267 | Tragic 5.8% |
| Immigrants | Sierra Leone | 0.1 /100 | #268 | Tragic 5.8% |
| Immigrants | El Salvador | 0.1 /100 | #269 | Tragic 5.8% |
| Blackfeet | 0.1 /100 | #270 | Tragic 5.8% |