Slovak vs Eastern European Unemployment Among Women with Children Under 18 years
COMPARE
Slovak
Eastern European
Unemployment Among Women with Children Under 18 years
Unemployment Among Women with Children Under 18 years Comparison
Slovaks
Eastern Europeans
5.3%
UNEMPLOYMENT AMONG WOMEN WITH CHILDREN UNDER 18 YEARS
80.5/ 100
METRIC RATING
134th/ 347
METRIC RANK
5.0%
UNEMPLOYMENT AMONG WOMEN WITH CHILDREN UNDER 18 YEARS
98.9/ 100
METRIC RATING
42nd/ 347
METRIC RANK
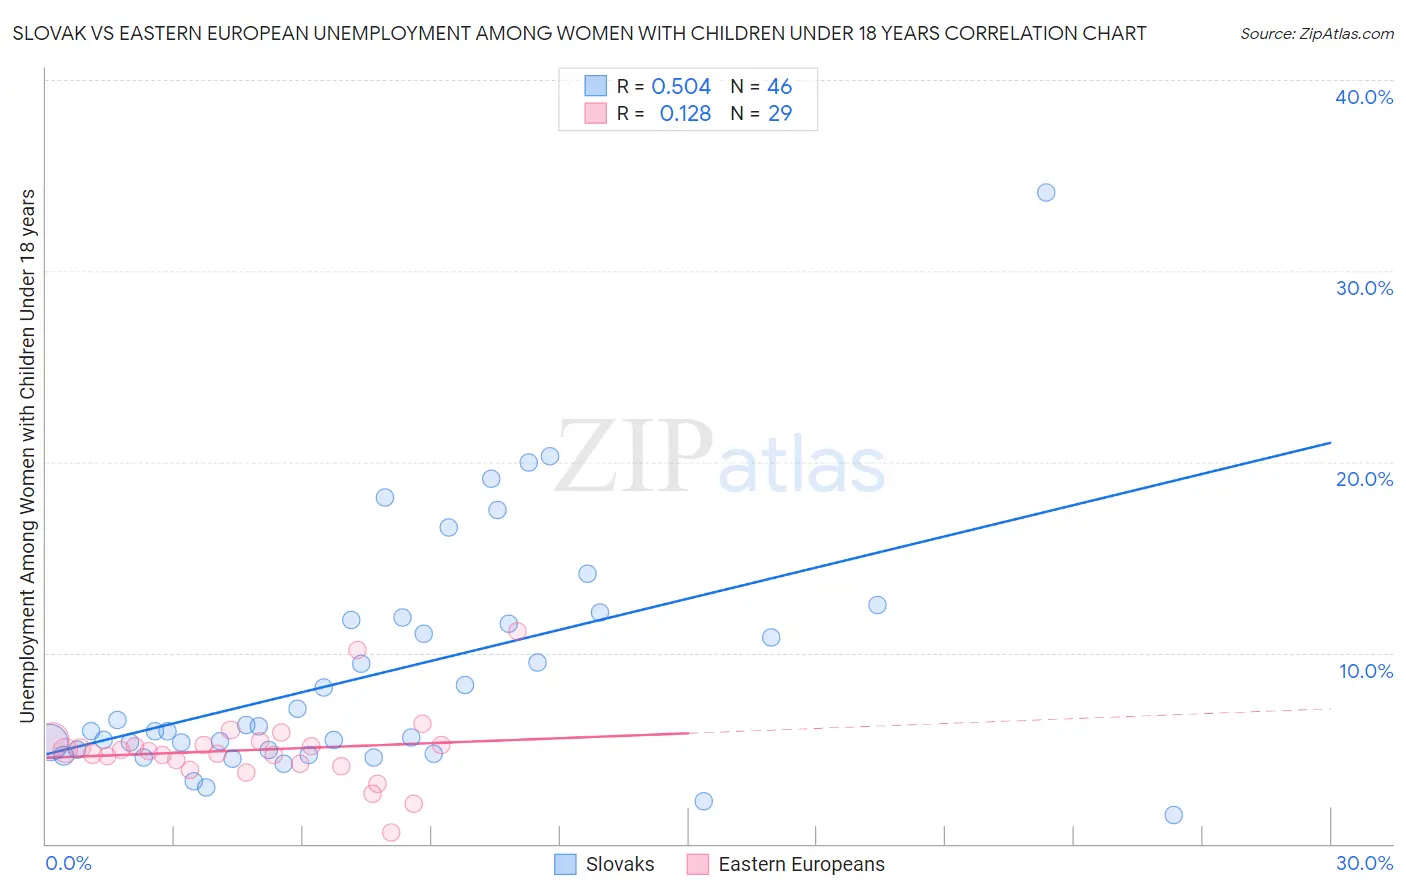
Slovak vs Eastern European Unemployment Among Women with Children Under 18 years Correlation Chart
The statistical analysis conducted on geographies consisting of 376,334,791 people shows a substantial positive correlation between the proportion of Slovaks and unemployment rate among women with children under the age of 18 in the United States with a correlation coefficient (R) of 0.504 and weighted average of 5.3%. Similarly, the statistical analysis conducted on geographies consisting of 432,926,663 people shows a poor positive correlation between the proportion of Eastern Europeans and unemployment rate among women with children under the age of 18 in the United States with a correlation coefficient (R) of 0.128 and weighted average of 5.0%, a difference of 6.0%.
Unemployment Among Women with Children Under 18 years Correlation Summary
| Measurement | Slovak | Eastern European |
| Minimum | 1.5% | 0.60% |
| Maximum | 34.1% | 11.1% |
| Range | 32.6% | 10.5% |
| Mean | 8.9% | 4.9% |
| Median | 6.0% | 4.8% |
| Interquartile 25% (IQ1) | 4.9% | 4.1% |
| Interquartile 75% (IQ3) | 11.7% | 5.3% |
| Interquartile Range (IQR) | 6.8% | 1.2% |
| Standard Deviation (Sample) | 6.3% | 2.0% |
| Standard Deviation (Population) | 6.2% | 1.9% |
Similar Demographics by Unemployment Among Women with Children Under 18 years
Demographics Similar to Slovaks by Unemployment Among Women with Children Under 18 years
In terms of unemployment among women with children under 18 years, the demographic groups most similar to Slovaks are Ethiopian (5.3%, a difference of 0.020%), New Zealander (5.3%, a difference of 0.070%), Immigrants from Ethiopia (5.3%, a difference of 0.11%), Immigrants from Jordan (5.3%, a difference of 0.12%), and Immigrants from Israel (5.3%, a difference of 0.17%).
| Demographics | Rating | Rank | Unemployment Among Women with Children Under 18 years |
| Whites/Caucasians | 82.9 /100 | #127 | Excellent 5.3% |
| Immigrants | South Africa | 82.8 /100 | #128 | Excellent 5.3% |
| Immigrants | Italy | 82.3 /100 | #129 | Excellent 5.3% |
| Immigrants | Austria | 82.1 /100 | #130 | Excellent 5.3% |
| Immigrants | Israel | 81.9 /100 | #131 | Excellent 5.3% |
| Immigrants | Ethiopia | 81.4 /100 | #132 | Excellent 5.3% |
| Ethiopians | 80.7 /100 | #133 | Excellent 5.3% |
| Slovaks | 80.5 /100 | #134 | Excellent 5.3% |
| New Zealanders | 79.9 /100 | #135 | Good 5.3% |
| Immigrants | Jordan | 79.5 /100 | #136 | Good 5.3% |
| Jordanians | 78.8 /100 | #137 | Good 5.3% |
| Argentineans | 78.8 /100 | #138 | Good 5.3% |
| Immigrants | Ukraine | 78.5 /100 | #139 | Good 5.3% |
| Immigrants | Norway | 76.2 /100 | #140 | Good 5.3% |
| Venezuelans | 76.0 /100 | #141 | Good 5.3% |
Demographics Similar to Eastern Europeans by Unemployment Among Women with Children Under 18 years
In terms of unemployment among women with children under 18 years, the demographic groups most similar to Eastern Europeans are Turkish (5.0%, a difference of 0.050%), Immigrants from Bosnia and Herzegovina (5.0%, a difference of 0.080%), Immigrants from Moldova (5.0%, a difference of 0.11%), Greek (5.0%, a difference of 0.14%), and Immigrants from Malaysia (5.0%, a difference of 0.20%).
| Demographics | Rating | Rank | Unemployment Among Women with Children Under 18 years |
| Luxembourgers | 99.2 /100 | #35 | Exceptional 5.0% |
| Mongolians | 99.2 /100 | #36 | Exceptional 5.0% |
| Poles | 99.2 /100 | #37 | Exceptional 5.0% |
| Bhutanese | 99.2 /100 | #38 | Exceptional 5.0% |
| English | 99.1 /100 | #39 | Exceptional 5.0% |
| Greeks | 99.0 /100 | #40 | Exceptional 5.0% |
| Immigrants | Bosnia and Herzegovina | 99.0 /100 | #41 | Exceptional 5.0% |
| Eastern Europeans | 98.9 /100 | #42 | Exceptional 5.0% |
| Turks | 98.9 /100 | #43 | Exceptional 5.0% |
| Immigrants | Moldova | 98.9 /100 | #44 | Exceptional 5.0% |
| Immigrants | Malaysia | 98.8 /100 | #45 | Exceptional 5.0% |
| Immigrants | Korea | 98.7 /100 | #46 | Exceptional 5.0% |
| British | 98.7 /100 | #47 | Exceptional 5.0% |
| Northern Europeans | 98.6 /100 | #48 | Exceptional 5.0% |
| Lithuanians | 98.4 /100 | #49 | Exceptional 5.0% |