Paraguayan vs Senegalese Unemployment Among Women with Children Under 18 years
COMPARE
Paraguayan
Senegalese
Unemployment Among Women with Children Under 18 years
Unemployment Among Women with Children Under 18 years Comparison
Paraguayans
Senegalese
5.2%
UNEMPLOYMENT AMONG WOMEN WITH CHILDREN UNDER 18 YEARS
94.8/ 100
METRIC RATING
85th/ 347
METRIC RANK
6.2%
UNEMPLOYMENT AMONG WOMEN WITH CHILDREN UNDER 18 YEARS
0.0/ 100
METRIC RATING
274th/ 347
METRIC RANK
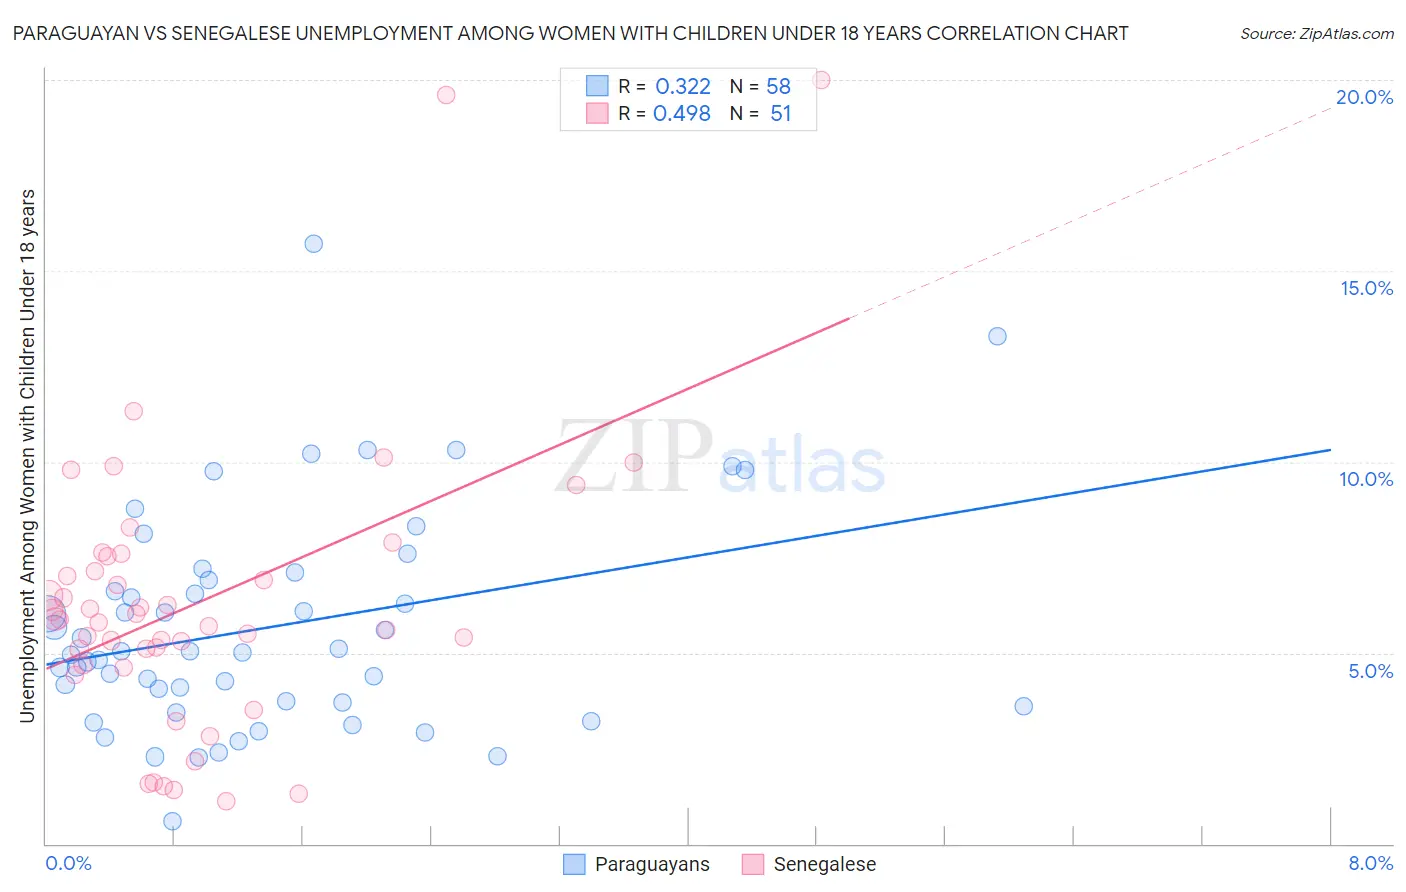
Paraguayan vs Senegalese Unemployment Among Women with Children Under 18 years Correlation Chart
The statistical analysis conducted on geographies consisting of 93,997,899 people shows a mild positive correlation between the proportion of Paraguayans and unemployment rate among women with children under the age of 18 in the United States with a correlation coefficient (R) of 0.322 and weighted average of 5.2%. Similarly, the statistical analysis conducted on geographies consisting of 77,660,225 people shows a moderate positive correlation between the proportion of Senegalese and unemployment rate among women with children under the age of 18 in the United States with a correlation coefficient (R) of 0.498 and weighted average of 6.2%, a difference of 20.3%.
Unemployment Among Women with Children Under 18 years Correlation Summary
| Measurement | Paraguayan | Senegalese |
| Minimum | 0.60% | 1.1% |
| Maximum | 15.7% | 20.0% |
| Range | 15.1% | 18.9% |
| Mean | 5.7% | 6.3% |
| Median | 5.0% | 5.9% |
| Interquartile 25% (IQ1) | 3.7% | 4.7% |
| Interquartile 75% (IQ3) | 6.9% | 7.5% |
| Interquartile Range (IQR) | 3.2% | 2.9% |
| Standard Deviation (Sample) | 2.9% | 3.7% |
| Standard Deviation (Population) | 2.8% | 3.6% |
Similar Demographics by Unemployment Among Women with Children Under 18 years
Demographics Similar to Paraguayans by Unemployment Among Women with Children Under 18 years
In terms of unemployment among women with children under 18 years, the demographic groups most similar to Paraguayans are Immigrants from Indonesia (5.2%, a difference of 0.010%), Laotian (5.2%, a difference of 0.040%), Maltese (5.2%, a difference of 0.11%), Australian (5.2%, a difference of 0.11%), and Immigrants from Scotland (5.2%, a difference of 0.12%).
| Demographics | Rating | Rank | Unemployment Among Women with Children Under 18 years |
| Assyrians/Chaldeans/Syriacs | 95.7 /100 | #78 | Exceptional 5.1% |
| Immigrants | Croatia | 95.6 /100 | #79 | Exceptional 5.1% |
| Bolivians | 95.5 /100 | #80 | Exceptional 5.1% |
| Immigrants | Lithuania | 95.4 /100 | #81 | Exceptional 5.2% |
| Romanians | 95.3 /100 | #82 | Exceptional 5.2% |
| Maltese | 95.1 /100 | #83 | Exceptional 5.2% |
| Australians | 95.1 /100 | #84 | Exceptional 5.2% |
| Paraguayans | 94.8 /100 | #85 | Exceptional 5.2% |
| Immigrants | Indonesia | 94.8 /100 | #86 | Exceptional 5.2% |
| Laotians | 94.7 /100 | #87 | Exceptional 5.2% |
| Immigrants | Scotland | 94.5 /100 | #88 | Exceptional 5.2% |
| Immigrants | Turkey | 94.2 /100 | #89 | Exceptional 5.2% |
| Ukrainians | 93.8 /100 | #90 | Exceptional 5.2% |
| Immigrants | Zimbabwe | 93.6 /100 | #91 | Exceptional 5.2% |
| Immigrants | Pakistan | 93.3 /100 | #92 | Exceptional 5.2% |
Demographics Similar to Senegalese by Unemployment Among Women with Children Under 18 years
In terms of unemployment among women with children under 18 years, the demographic groups most similar to Senegalese are Immigrants from Western Africa (6.2%, a difference of 0.020%), Salvadoran (6.2%, a difference of 0.10%), Dutch West Indian (6.2%, a difference of 0.18%), Immigrants from Ghana (6.2%, a difference of 0.28%), and Mexican American Indian (6.2%, a difference of 0.30%).
| Demographics | Rating | Rank | Unemployment Among Women with Children Under 18 years |
| French American Indians | 0.1 /100 | #267 | Tragic 6.2% |
| Trinidadians and Tobagonians | 0.1 /100 | #268 | Tragic 6.2% |
| Cajuns | 0.1 /100 | #269 | Tragic 6.2% |
| Ghanaians | 0.1 /100 | #270 | Tragic 6.2% |
| Central Americans | 0.0 /100 | #271 | Tragic 6.2% |
| Salvadorans | 0.0 /100 | #272 | Tragic 6.2% |
| Immigrants | Western Africa | 0.0 /100 | #273 | Tragic 6.2% |
| Senegalese | 0.0 /100 | #274 | Tragic 6.2% |
| Dutch West Indians | 0.0 /100 | #275 | Tragic 6.2% |
| Immigrants | Ghana | 0.0 /100 | #276 | Tragic 6.2% |
| Mexican American Indians | 0.0 /100 | #277 | Tragic 6.2% |
| Immigrants | Barbados | 0.0 /100 | #278 | Tragic 6.2% |
| Immigrants | Portugal | 0.0 /100 | #279 | Tragic 6.3% |
| Guatemalans | 0.0 /100 | #280 | Tragic 6.3% |
| Immigrants | El Salvador | 0.0 /100 | #281 | Tragic 6.3% |