Lebanese vs Immigrants from Philippines Female Unemployment
COMPARE
Lebanese
Immigrants from Philippines
Female Unemployment
Female Unemployment Comparison
Lebanese
Immigrants from Philippines
5.1%
FEMALE UNEMPLOYMENT
91.0/ 100
METRIC RATING
115th/ 347
METRIC RANK
5.5%
FEMALE UNEMPLOYMENT
5.3/ 100
METRIC RATING
227th/ 347
METRIC RANK
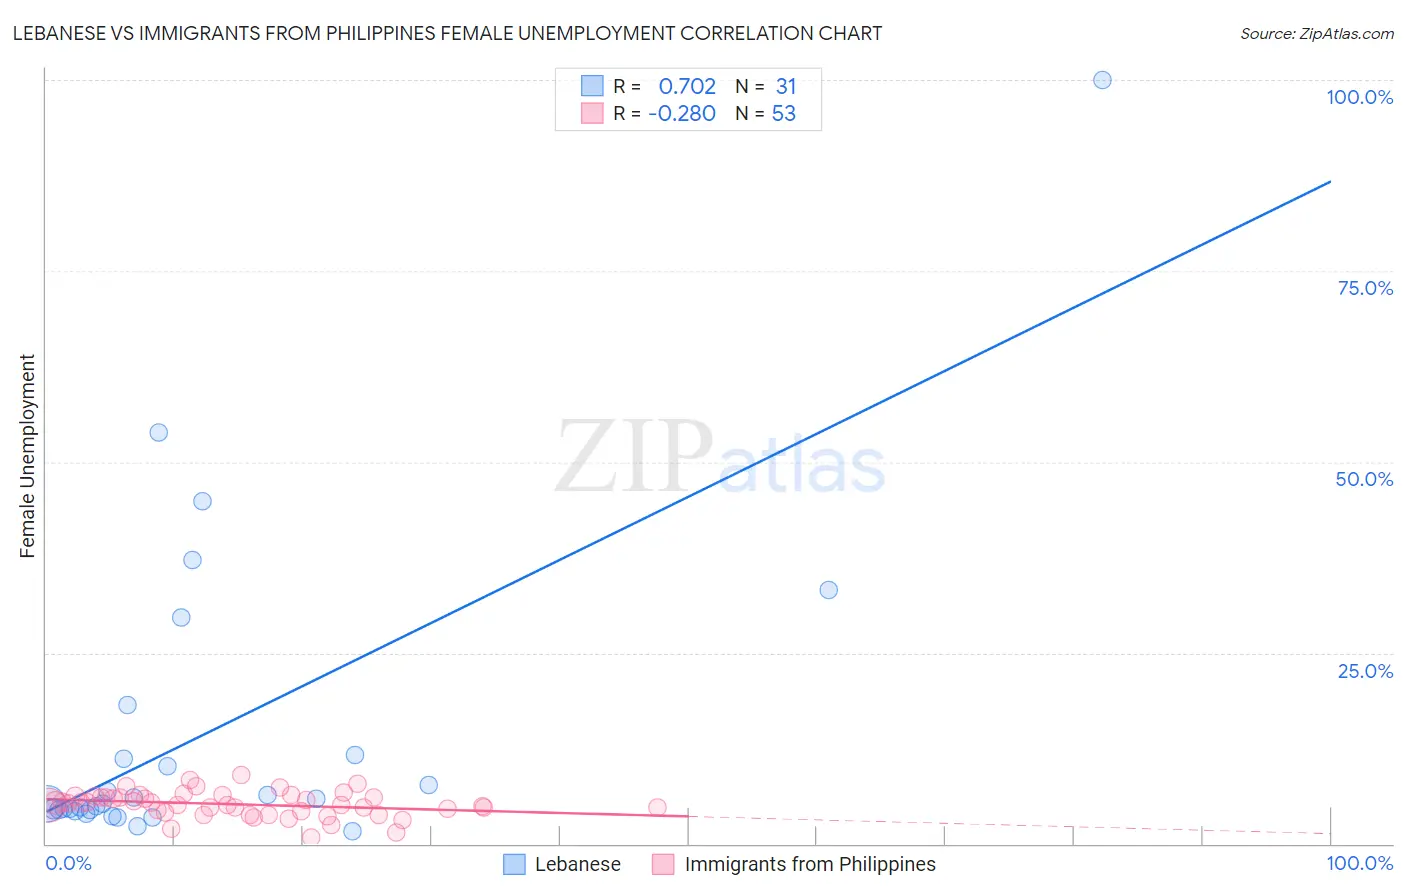
Lebanese vs Immigrants from Philippines Female Unemployment Correlation Chart
The statistical analysis conducted on geographies consisting of 399,531,813 people shows a strong positive correlation between the proportion of Lebanese and unemploymnet rate among females in the United States with a correlation coefficient (R) of 0.702 and weighted average of 5.1%. Similarly, the statistical analysis conducted on geographies consisting of 468,047,266 people shows a weak negative correlation between the proportion of Immigrants from Philippines and unemploymnet rate among females in the United States with a correlation coefficient (R) of -0.280 and weighted average of 5.5%, a difference of 8.1%.
Female Unemployment Correlation Summary
| Measurement | Lebanese | Immigrants from Philippines |
| Minimum | 1.6% | 0.80% |
| Maximum | 100.0% | 9.0% |
| Range | 98.4% | 8.2% |
| Mean | 14.5% | 5.2% |
| Median | 5.2% | 5.3% |
| Interquartile 25% (IQ1) | 4.4% | 4.2% |
| Interquartile 75% (IQ3) | 11.6% | 6.2% |
| Interquartile Range (IQR) | 7.2% | 1.9% |
| Standard Deviation (Sample) | 20.8% | 1.6% |
| Standard Deviation (Population) | 20.5% | 1.6% |
Similar Demographics by Female Unemployment
Demographics Similar to Lebanese by Female Unemployment
In terms of female unemployment, the demographic groups most similar to Lebanese are Immigrants from Turkey (5.1%, a difference of 0.020%), Immigrants from Saudi Arabia (5.1%, a difference of 0.050%), American (5.1%, a difference of 0.080%), Jordanian (5.1%, a difference of 0.12%), and Immigrants from Croatia (5.1%, a difference of 0.18%).
| Demographics | Rating | Rank | Female Unemployment |
| Puget Sound Salish | 93.0 /100 | #108 | Exceptional 5.1% |
| Immigrants | Eastern Africa | 92.8 /100 | #109 | Exceptional 5.1% |
| Macedonians | 92.4 /100 | #110 | Exceptional 5.1% |
| Immigrants | Burma/Myanmar | 92.3 /100 | #111 | Exceptional 5.1% |
| Estonians | 92.1 /100 | #112 | Exceptional 5.1% |
| Immigrants | Saudi Arabia | 91.2 /100 | #113 | Exceptional 5.1% |
| Immigrants | Turkey | 91.0 /100 | #114 | Exceptional 5.1% |
| Lebanese | 91.0 /100 | #115 | Exceptional 5.1% |
| Americans | 90.5 /100 | #116 | Exceptional 5.1% |
| Jordanians | 90.3 /100 | #117 | Exceptional 5.1% |
| Immigrants | Croatia | 89.9 /100 | #118 | Excellent 5.1% |
| Immigrants | North Macedonia | 88.3 /100 | #119 | Excellent 5.1% |
| Immigrants | Romania | 88.1 /100 | #120 | Excellent 5.1% |
| Immigrants | Western Europe | 88.1 /100 | #121 | Excellent 5.1% |
| Immigrants | Germany | 87.6 /100 | #122 | Excellent 5.1% |
Demographics Similar to Immigrants from Philippines by Female Unemployment
In terms of female unemployment, the demographic groups most similar to Immigrants from Philippines are Israeli (5.5%, a difference of 0.16%), Immigrants from Peru (5.5%, a difference of 0.17%), Panamanian (5.5%, a difference of 0.17%), Immigrants from Uruguay (5.5%, a difference of 0.18%), and French American Indian (5.5%, a difference of 0.21%).
| Demographics | Rating | Rank | Female Unemployment |
| Immigrants | Africa | 8.5 /100 | #220 | Tragic 5.4% |
| Brazilians | 7.3 /100 | #221 | Tragic 5.5% |
| Nicaraguans | 7.2 /100 | #222 | Tragic 5.5% |
| Delaware | 7.2 /100 | #223 | Tragic 5.5% |
| Iraqis | 7.1 /100 | #224 | Tragic 5.5% |
| French American Indians | 6.1 /100 | #225 | Tragic 5.5% |
| Immigrants | Peru | 5.9 /100 | #226 | Tragic 5.5% |
| Immigrants | Philippines | 5.3 /100 | #227 | Tragic 5.5% |
| Israelis | 4.8 /100 | #228 | Tragic 5.5% |
| Panamanians | 4.7 /100 | #229 | Tragic 5.5% |
| Immigrants | Uruguay | 4.7 /100 | #230 | Tragic 5.5% |
| Immigrants | Iraq | 3.9 /100 | #231 | Tragic 5.5% |
| Liberians | 3.9 /100 | #232 | Tragic 5.5% |
| Moroccans | 3.4 /100 | #233 | Tragic 5.5% |
| Immigrants | Lebanon | 3.3 /100 | #234 | Tragic 5.5% |