Fijian vs Bermudan Unemployment Among Ages 65 to 74 years
COMPARE
Fijian
Bermudan
Unemployment Among Ages 65 to 74 years
Unemployment Among Ages 65 to 74 years Comparison
Fijians
Bermudans
4.5%
UNEMPLOYMENT AMONG AGES 65 TO 74 YEARS
100.0/ 100
METRIC RATING
3rd/ 347
METRIC RANK
6.3%
UNEMPLOYMENT AMONG AGES 65 TO 74 YEARS
0.0/ 100
METRIC RATING
331st/ 347
METRIC RANK
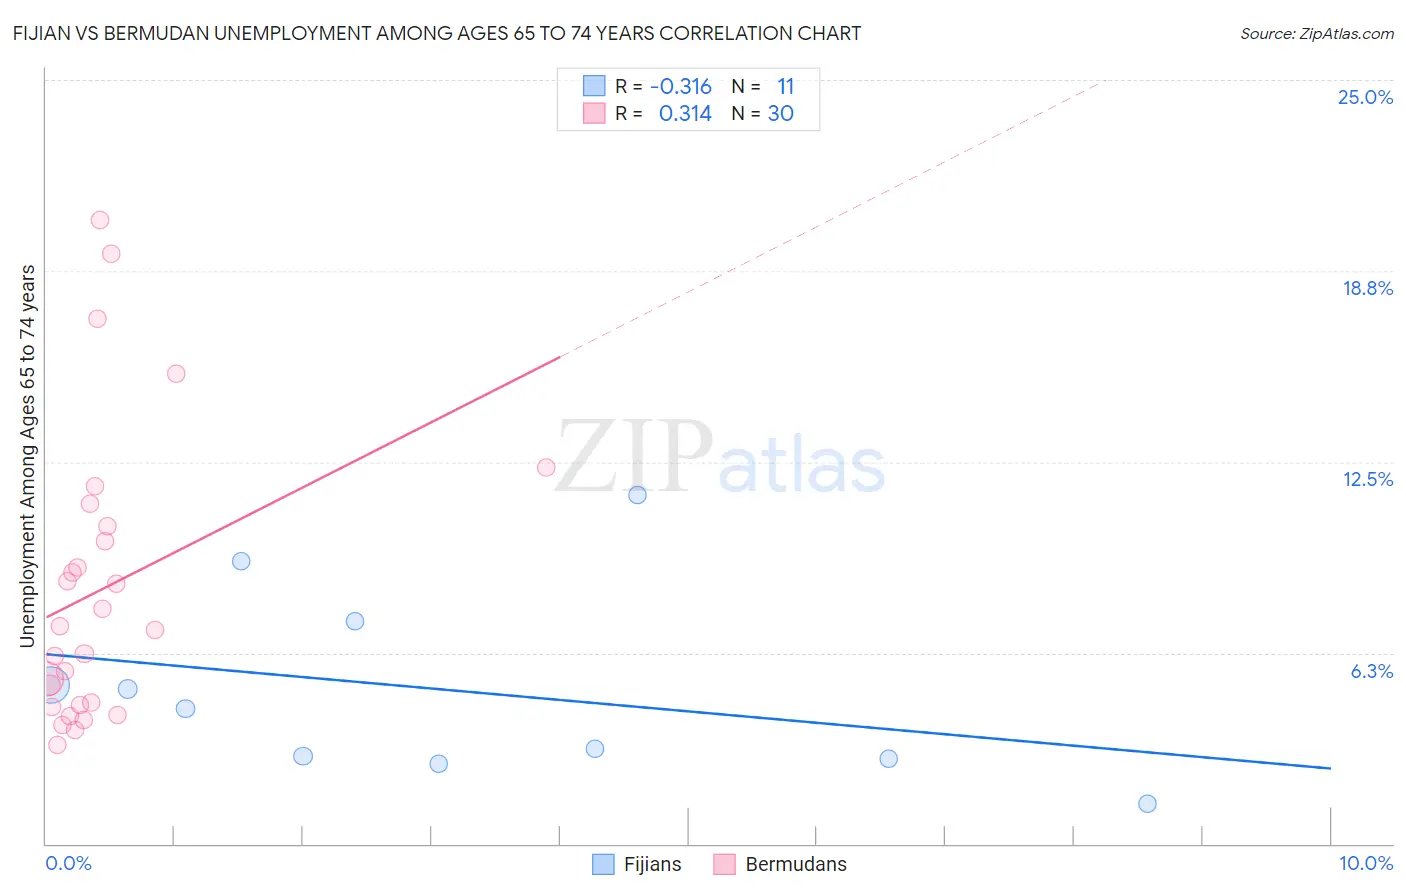
Fijian vs Bermudan Unemployment Among Ages 65 to 74 years Correlation Chart
The statistical analysis conducted on geographies consisting of 52,432,761 people shows a mild negative correlation between the proportion of Fijians and unemployment rate among population between the ages 65 and 74 in the United States with a correlation coefficient (R) of -0.316 and weighted average of 4.5%. Similarly, the statistical analysis conducted on geographies consisting of 54,099,424 people shows a mild positive correlation between the proportion of Bermudans and unemployment rate among population between the ages 65 and 74 in the United States with a correlation coefficient (R) of 0.314 and weighted average of 6.3%, a difference of 38.8%.
Unemployment Among Ages 65 to 74 years Correlation Summary
| Measurement | Fijian | Bermudan |
| Minimum | 1.3% | 3.2% |
| Maximum | 11.4% | 20.4% |
| Range | 10.1% | 17.2% |
| Mean | 5.0% | 8.3% |
| Median | 4.4% | 7.1% |
| Interquartile 25% (IQ1) | 2.8% | 4.5% |
| Interquartile 75% (IQ3) | 7.3% | 10.4% |
| Interquartile Range (IQR) | 4.5% | 5.9% |
| Standard Deviation (Sample) | 3.1% | 4.7% |
| Standard Deviation (Population) | 3.0% | 4.6% |
Similar Demographics by Unemployment Among Ages 65 to 74 years
Demographics Similar to Fijians by Unemployment Among Ages 65 to 74 years
In terms of unemployment among ages 65 to 74 years, the demographic groups most similar to Fijians are Tsimshian (4.6%, a difference of 1.5%), Chinese (4.4%, a difference of 1.6%), Sudanese (4.6%, a difference of 1.9%), Immigrants from Cuba (4.6%, a difference of 2.4%), and Indonesian (4.7%, a difference of 3.9%).
| Demographics | Rating | Rank | Unemployment Among Ages 65 to 74 years |
| Hmong | 100.0 /100 | #1 | Exceptional 4.2% |
| Chinese | 100.0 /100 | #2 | Exceptional 4.4% |
| Fijians | 100.0 /100 | #3 | Exceptional 4.5% |
| Tsimshian | 100.0 /100 | #4 | Exceptional 4.6% |
| Sudanese | 100.0 /100 | #5 | Exceptional 4.6% |
| Immigrants | Cuba | 100.0 /100 | #6 | Exceptional 4.6% |
| Indonesians | 100.0 /100 | #7 | Exceptional 4.7% |
| Comanche | 100.0 /100 | #8 | Exceptional 4.7% |
| Chickasaw | 100.0 /100 | #9 | Exceptional 4.7% |
| Osage | 100.0 /100 | #10 | Exceptional 4.7% |
| Immigrants | Congo | 100.0 /100 | #11 | Exceptional 4.7% |
| Tongans | 100.0 /100 | #12 | Exceptional 4.7% |
| Lumbee | 100.0 /100 | #13 | Exceptional 4.8% |
| Cubans | 100.0 /100 | #14 | Exceptional 4.8% |
| Immigrants | North Macedonia | 100.0 /100 | #15 | Exceptional 4.8% |
Demographics Similar to Bermudans by Unemployment Among Ages 65 to 74 years
In terms of unemployment among ages 65 to 74 years, the demographic groups most similar to Bermudans are Dominican (6.3%, a difference of 0.14%), Immigrants from Dominican Republic (6.3%, a difference of 0.32%), Paiute (6.3%, a difference of 0.42%), Yuman (6.2%, a difference of 0.45%), and Taiwanese (6.3%, a difference of 0.53%).
| Demographics | Rating | Rank | Unemployment Among Ages 65 to 74 years |
| Tohono O'odham | 0.0 /100 | #324 | Tragic 6.0% |
| Immigrants | Portugal | 0.0 /100 | #325 | Tragic 6.0% |
| Natives/Alaskans | 0.0 /100 | #326 | Tragic 6.0% |
| Shoshone | 0.0 /100 | #327 | Tragic 6.2% |
| Immigrants | Azores | 0.0 /100 | #328 | Tragic 6.2% |
| Yuman | 0.0 /100 | #329 | Tragic 6.2% |
| Dominicans | 0.0 /100 | #330 | Tragic 6.3% |
| Bermudans | 0.0 /100 | #331 | Tragic 6.3% |
| Immigrants | Dominican Republic | 0.0 /100 | #332 | Tragic 6.3% |
| Paiute | 0.0 /100 | #333 | Tragic 6.3% |
| Taiwanese | 0.0 /100 | #334 | Tragic 6.3% |
| Puerto Ricans | 0.0 /100 | #335 | Tragic 6.4% |
| Immigrants | Armenia | 0.0 /100 | #336 | Tragic 6.5% |
| Ute | 0.0 /100 | #337 | Tragic 6.5% |
| Tlingit-Haida | 0.0 /100 | #338 | Tragic 6.5% |