Immigrants from El Salvador vs Bermudan Unemployment Among Ages 65 to 74 years
COMPARE
Immigrants from El Salvador
Bermudan
Unemployment Among Ages 65 to 74 years
Unemployment Among Ages 65 to 74 years Comparison
Immigrants from El Salvador
Bermudans
5.9%
UNEMPLOYMENT AMONG AGES 65 TO 74 YEARS
0.0/ 100
METRIC RATING
316th/ 347
METRIC RANK
6.3%
UNEMPLOYMENT AMONG AGES 65 TO 74 YEARS
0.0/ 100
METRIC RATING
331st/ 347
METRIC RANK
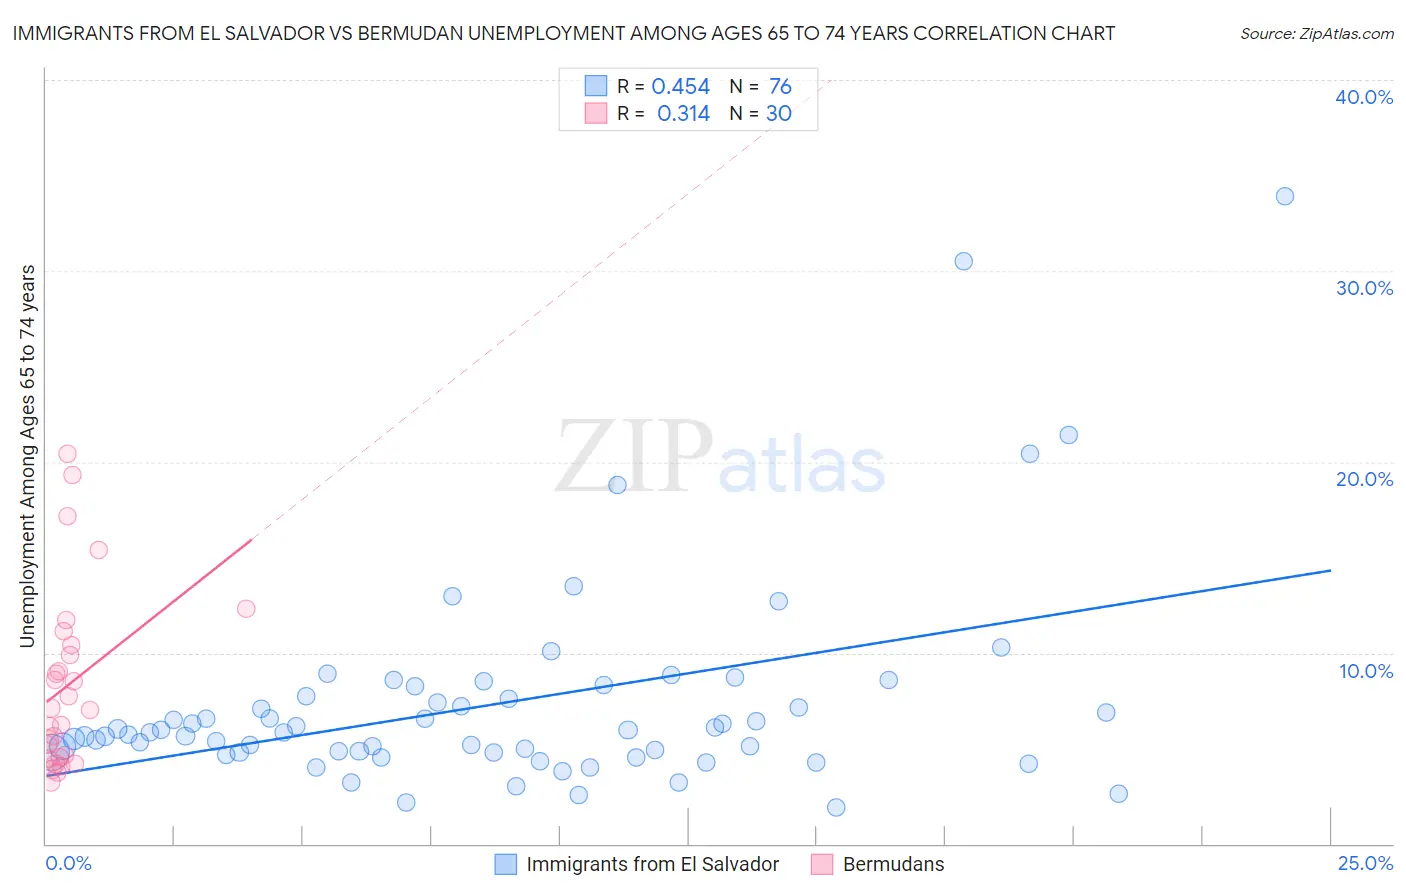
Immigrants from El Salvador vs Bermudan Unemployment Among Ages 65 to 74 years Correlation Chart
The statistical analysis conducted on geographies consisting of 318,434,053 people shows a moderate positive correlation between the proportion of Immigrants from El Salvador and unemployment rate among population between the ages 65 and 74 in the United States with a correlation coefficient (R) of 0.454 and weighted average of 5.9%. Similarly, the statistical analysis conducted on geographies consisting of 54,099,424 people shows a mild positive correlation between the proportion of Bermudans and unemployment rate among population between the ages 65 and 74 in the United States with a correlation coefficient (R) of 0.314 and weighted average of 6.3%, a difference of 6.4%.
Unemployment Among Ages 65 to 74 years Correlation Summary
| Measurement | Immigrants from El Salvador | Bermudan |
| Minimum | 1.9% | 3.2% |
| Maximum | 33.9% | 20.4% |
| Range | 32.0% | 17.2% |
| Mean | 7.3% | 8.3% |
| Median | 5.8% | 7.1% |
| Interquartile 25% (IQ1) | 4.8% | 4.5% |
| Interquartile 75% (IQ3) | 7.7% | 10.4% |
| Interquartile Range (IQR) | 2.9% | 5.9% |
| Standard Deviation (Sample) | 5.5% | 4.7% |
| Standard Deviation (Population) | 5.4% | 4.6% |
Demographics Similar to Immigrants from El Salvador and Bermudans by Unemployment Among Ages 65 to 74 years
In terms of unemployment among ages 65 to 74 years, the demographic groups most similar to Immigrants from El Salvador are Immigrants from Guatemala (5.9%, a difference of 0.32%), Immigrants from Venezuela (5.9%, a difference of 0.33%), Immigrants from Central America (5.9%, a difference of 0.49%), Vietnamese (5.9%, a difference of 0.51%), and Zimbabwean (5.9%, a difference of 0.76%). Similarly, the demographic groups most similar to Bermudans are Dominican (6.3%, a difference of 0.14%), Immigrants from Dominican Republic (6.3%, a difference of 0.32%), Paiute (6.3%, a difference of 0.42%), Yuman (6.2%, a difference of 0.45%), and Immigrants from the Azores (6.2%, a difference of 0.80%).
| Demographics | Rating | Rank | Unemployment Among Ages 65 to 74 years |
| Vietnamese | 0.0 /100 | #313 | Tragic 5.9% |
| Immigrants | Venezuela | 0.0 /100 | #314 | Tragic 5.9% |
| Immigrants | Guatemala | 0.0 /100 | #315 | Tragic 5.9% |
| Immigrants | El Salvador | 0.0 /100 | #316 | Tragic 5.9% |
| Immigrants | Central America | 0.0 /100 | #317 | Tragic 5.9% |
| Zimbabweans | 0.0 /100 | #318 | Tragic 5.9% |
| Aleuts | 0.0 /100 | #319 | Tragic 5.9% |
| Immigrants | Bahamas | 0.0 /100 | #320 | Tragic 5.9% |
| Immigrants | Dominica | 0.0 /100 | #321 | Tragic 6.0% |
| Immigrants | Mexico | 0.0 /100 | #322 | Tragic 6.0% |
| Delaware | 0.0 /100 | #323 | Tragic 6.0% |
| Tohono O'odham | 0.0 /100 | #324 | Tragic 6.0% |
| Immigrants | Portugal | 0.0 /100 | #325 | Tragic 6.0% |
| Natives/Alaskans | 0.0 /100 | #326 | Tragic 6.0% |
| Shoshone | 0.0 /100 | #327 | Tragic 6.2% |
| Immigrants | Azores | 0.0 /100 | #328 | Tragic 6.2% |
| Yuman | 0.0 /100 | #329 | Tragic 6.2% |
| Dominicans | 0.0 /100 | #330 | Tragic 6.3% |
| Bermudans | 0.0 /100 | #331 | Tragic 6.3% |
| Immigrants | Dominican Republic | 0.0 /100 | #332 | Tragic 6.3% |
| Paiute | 0.0 /100 | #333 | Tragic 6.3% |