Sioux vs Immigrants from Jordan Unemployment
COMPARE
Sioux
Immigrants from Jordan
Unemployment
Unemployment Comparison
Sioux
Immigrants from Jordan
7.4%
UNEMPLOYMENT
0.0/ 100
METRIC RATING
332nd/ 347
METRIC RANK
5.1%
UNEMPLOYMENT
86.6/ 100
METRIC RATING
133rd/ 347
METRIC RANK
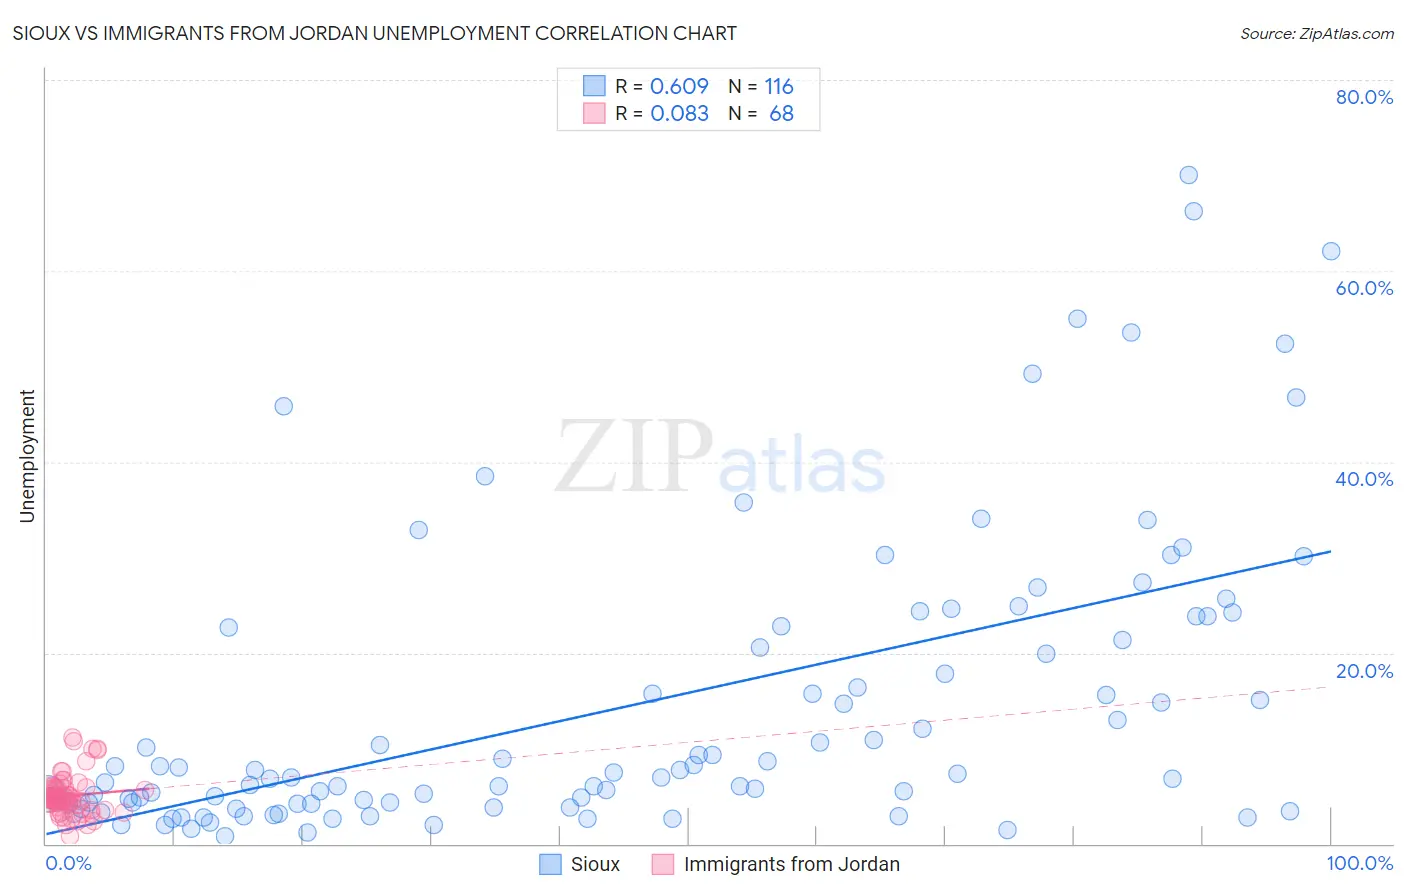
Sioux vs Immigrants from Jordan Unemployment Correlation Chart
The statistical analysis conducted on geographies consisting of 233,819,220 people shows a significant positive correlation between the proportion of Sioux and unemployment in the United States with a correlation coefficient (R) of 0.609 and weighted average of 7.4%. Similarly, the statistical analysis conducted on geographies consisting of 181,256,690 people shows a slight positive correlation between the proportion of Immigrants from Jordan and unemployment in the United States with a correlation coefficient (R) of 0.083 and weighted average of 5.1%, a difference of 44.7%.
Unemployment Correlation Summary
| Measurement | Sioux | Immigrants from Jordan |
| Minimum | 0.80% | 0.80% |
| Maximum | 70.0% | 11.1% |
| Range | 69.2% | 10.3% |
| Mean | 14.3% | 5.0% |
| Median | 7.1% | 4.7% |
| Interquartile 25% (IQ1) | 4.2% | 4.1% |
| Interquartile 75% (IQ3) | 22.0% | 5.8% |
| Interquartile Range (IQR) | 17.8% | 1.7% |
| Standard Deviation (Sample) | 15.4% | 2.0% |
| Standard Deviation (Population) | 15.3% | 2.0% |
Similar Demographics by Unemployment
Demographics Similar to Sioux by Unemployment
In terms of unemployment, the demographic groups most similar to Sioux are Immigrants from Dominican Republic (7.4%, a difference of 0.060%), Dominican (7.4%, a difference of 0.42%), Apache (7.4%, a difference of 0.53%), Yakama (7.3%, a difference of 0.76%), and Alaska Native (7.2%, a difference of 2.1%).
| Demographics | Rating | Rank | Unemployment |
| Natives/Alaskans | 0.0 /100 | #325 | Tragic 7.0% |
| Paiute | 0.0 /100 | #326 | Tragic 7.1% |
| Pueblo | 0.0 /100 | #327 | Tragic 7.2% |
| Tsimshian | 0.0 /100 | #328 | Tragic 7.2% |
| Alaska Natives | 0.0 /100 | #329 | Tragic 7.2% |
| Yakama | 0.0 /100 | #330 | Tragic 7.3% |
| Dominicans | 0.0 /100 | #331 | Tragic 7.4% |
| Sioux | 0.0 /100 | #332 | Tragic 7.4% |
| Immigrants | Dominican Republic | 0.0 /100 | #333 | Tragic 7.4% |
| Apache | 0.0 /100 | #334 | Tragic 7.4% |
| Alaskan Athabascans | 0.0 /100 | #335 | Tragic 7.7% |
| Immigrants | Yemen | 0.0 /100 | #336 | Tragic 7.7% |
| Cheyenne | 0.0 /100 | #337 | Tragic 8.0% |
| Pima | 0.0 /100 | #338 | Tragic 8.2% |
| Navajo | 0.0 /100 | #339 | Tragic 8.4% |
Demographics Similar to Immigrants from Jordan by Unemployment
In terms of unemployment, the demographic groups most similar to Immigrants from Jordan are Immigrants from Ethiopia (5.1%, a difference of 0.010%), Immigrants from Croatia (5.1%, a difference of 0.020%), Iranian (5.1%, a difference of 0.040%), Immigrants from Europe (5.1%, a difference of 0.040%), and Immigrants from Burma/Myanmar (5.1%, a difference of 0.050%).
| Demographics | Rating | Rank | Unemployment |
| Kenyans | 88.2 /100 | #126 | Excellent 5.1% |
| Immigrants | Kenya | 88.2 /100 | #127 | Excellent 5.1% |
| Immigrants | Eastern Africa | 88.1 /100 | #128 | Excellent 5.1% |
| Immigrants | Latvia | 88.0 /100 | #129 | Excellent 5.1% |
| Iranians | 86.9 /100 | #130 | Excellent 5.1% |
| Immigrants | Croatia | 86.8 /100 | #131 | Excellent 5.1% |
| Immigrants | Ethiopia | 86.7 /100 | #132 | Excellent 5.1% |
| Immigrants | Jordan | 86.6 /100 | #133 | Excellent 5.1% |
| Immigrants | Europe | 86.3 /100 | #134 | Excellent 5.1% |
| Immigrants | Burma/Myanmar | 86.2 /100 | #135 | Excellent 5.1% |
| Immigrants | Spain | 86.2 /100 | #136 | Excellent 5.1% |
| Immigrants | Saudi Arabia | 85.6 /100 | #137 | Excellent 5.1% |
| Immigrants | Hungary | 85.6 /100 | #138 | Excellent 5.1% |
| Pakistanis | 85.3 /100 | #139 | Excellent 5.1% |
| Immigrants | Denmark | 84.3 /100 | #140 | Excellent 5.1% |