Immigrants from Japan vs Immigrants from Kuwait Unemployment Among Ages 25 to 29 years
COMPARE
Immigrants from Japan
Immigrants from Kuwait
Unemployment Among Ages 25 to 29 years
Unemployment Among Ages 25 to 29 years Comparison
Immigrants from Japan
Immigrants from Kuwait
6.0%
UNEMPLOYMENT AMONG AGES 25 TO 29 YEARS
99.9/ 100
METRIC RATING
22nd/ 347
METRIC RANK
5.9%
UNEMPLOYMENT AMONG AGES 25 TO 29 YEARS
99.9/ 100
METRIC RATING
14th/ 347
METRIC RANK
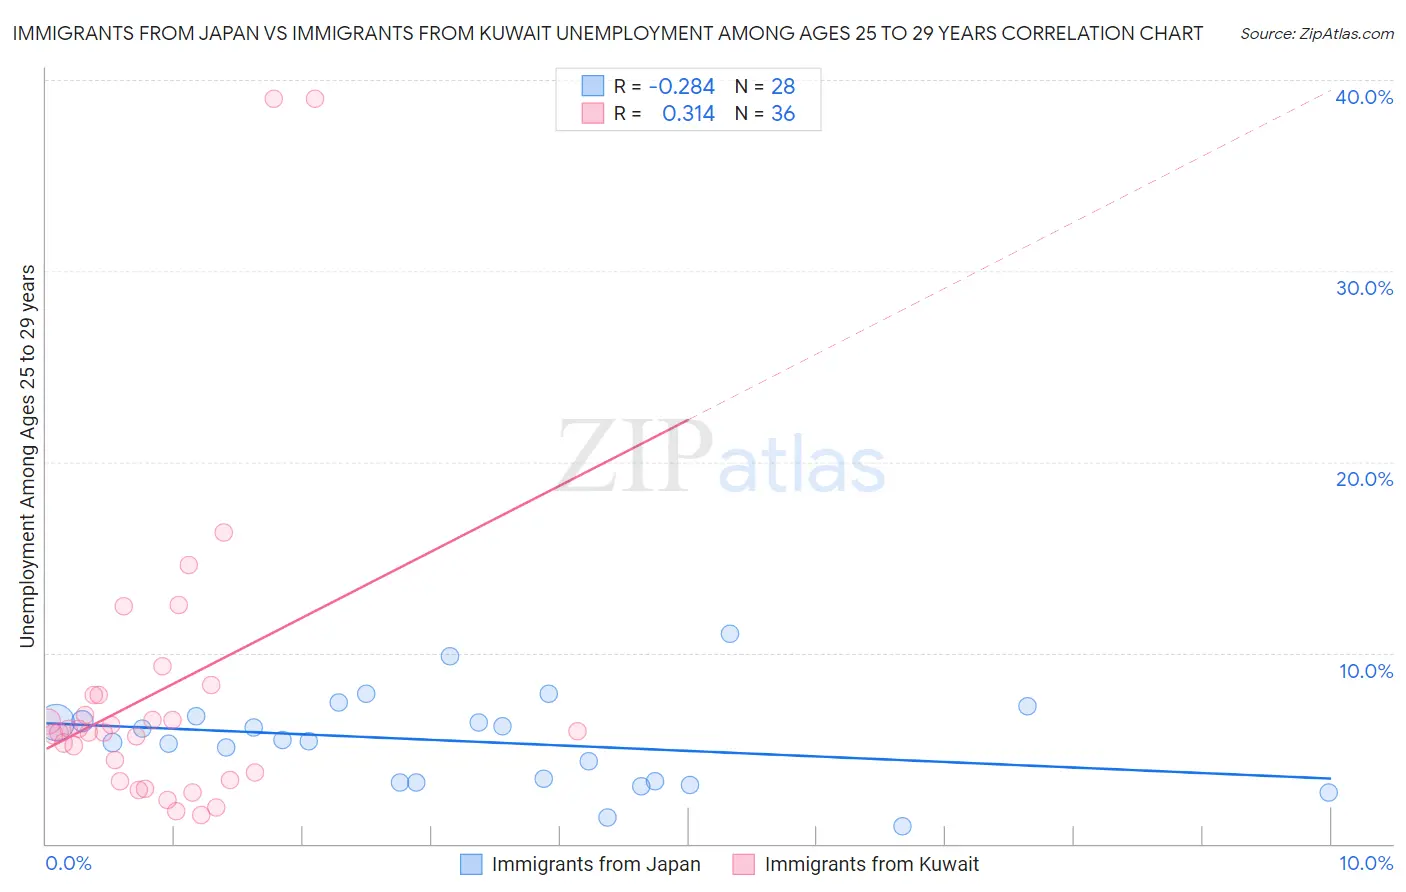
Immigrants from Japan vs Immigrants from Kuwait Unemployment Among Ages 25 to 29 years Correlation Chart
The statistical analysis conducted on geographies consisting of 327,117,798 people shows a weak negative correlation between the proportion of Immigrants from Japan and unemployment rate among population between the ages 25 and 29 in the United States with a correlation coefficient (R) of -0.284 and weighted average of 6.0%. Similarly, the statistical analysis conducted on geographies consisting of 135,474,180 people shows a mild positive correlation between the proportion of Immigrants from Kuwait and unemployment rate among population between the ages 25 and 29 in the United States with a correlation coefficient (R) of 0.314 and weighted average of 5.9%, a difference of 1.6%.
Unemployment Among Ages 25 to 29 years Correlation Summary
| Measurement | Immigrants from Japan | Immigrants from Kuwait |
| Minimum | 0.90% | 1.5% |
| Maximum | 11.0% | 39.0% |
| Range | 10.1% | 37.5% |
| Mean | 5.4% | 8.0% |
| Median | 5.4% | 5.9% |
| Interquartile 25% (IQ1) | 3.3% | 3.5% |
| Interquartile 75% (IQ3) | 6.5% | 7.8% |
| Interquartile Range (IQR) | 3.3% | 4.3% |
| Standard Deviation (Sample) | 2.4% | 8.4% |
| Standard Deviation (Population) | 2.3% | 8.2% |
Demographics Similar to Immigrants from Japan and Immigrants from Kuwait by Unemployment Among Ages 25 to 29 years
In terms of unemployment among ages 25 to 29 years, the demographic groups most similar to Immigrants from Japan are Immigrants from Venezuela (6.0%, a difference of 0.060%), Norwegian (6.0%, a difference of 0.11%), Immigrants from Ethiopia (6.0%, a difference of 0.27%), Immigrants from Eritrea (5.9%, a difference of 0.61%), and New Zealander (6.0%, a difference of 0.75%). Similarly, the demographic groups most similar to Immigrants from Kuwait are Cuban (5.9%, a difference of 0.35%), Immigrants from Bulgaria (5.9%, a difference of 0.36%), Bolivian (5.9%, a difference of 0.50%), Immigrants from Singapore (5.9%, a difference of 0.61%), and Immigrants from Bolivia (5.9%, a difference of 0.63%).
| Demographics | Rating | Rank | Unemployment Among Ages 25 to 29 years |
| Immigrants | Bosnia and Herzegovina | 100.0 /100 | #8 | Exceptional 5.7% |
| Immigrants | Nepal | 100.0 /100 | #9 | Exceptional 5.7% |
| Immigrants | Sudan | 100.0 /100 | #10 | Exceptional 5.8% |
| Cambodians | 100.0 /100 | #11 | Exceptional 5.8% |
| Okinawans | 100.0 /100 | #12 | Exceptional 5.9% |
| Immigrants | Bolivia | 100.0 /100 | #13 | Exceptional 5.9% |
| Immigrants | Kuwait | 99.9 /100 | #14 | Exceptional 5.9% |
| Cubans | 99.9 /100 | #15 | Exceptional 5.9% |
| Immigrants | Bulgaria | 99.9 /100 | #16 | Exceptional 5.9% |
| Bolivians | 99.9 /100 | #17 | Exceptional 5.9% |
| Immigrants | Singapore | 99.9 /100 | #18 | Exceptional 5.9% |
| Thais | 99.9 /100 | #19 | Exceptional 5.9% |
| Immigrants | Eritrea | 99.9 /100 | #20 | Exceptional 5.9% |
| Immigrants | Ethiopia | 99.9 /100 | #21 | Exceptional 6.0% |
| Immigrants | Japan | 99.9 /100 | #22 | Exceptional 6.0% |
| Immigrants | Venezuela | 99.8 /100 | #23 | Exceptional 6.0% |
| Norwegians | 99.8 /100 | #24 | Exceptional 6.0% |
| New Zealanders | 99.8 /100 | #25 | Exceptional 6.0% |
| Immigrants | Eastern Africa | 99.8 /100 | #26 | Exceptional 6.0% |
| Immigrants | Zaire | 99.7 /100 | #27 | Exceptional 6.0% |
| Danes | 99.7 /100 | #28 | Exceptional 6.0% |