Serbian vs South American Female Unemployment
COMPARE
Serbian
South American
Female Unemployment
Female Unemployment Comparison
Serbians
South Americans
4.9%
FEMALE UNEMPLOYMENT
99.0/ 100
METRIC RATING
56th/ 347
METRIC RANK
5.4%
FEMALE UNEMPLOYMENT
8.6/ 100
METRIC RATING
219th/ 347
METRIC RANK
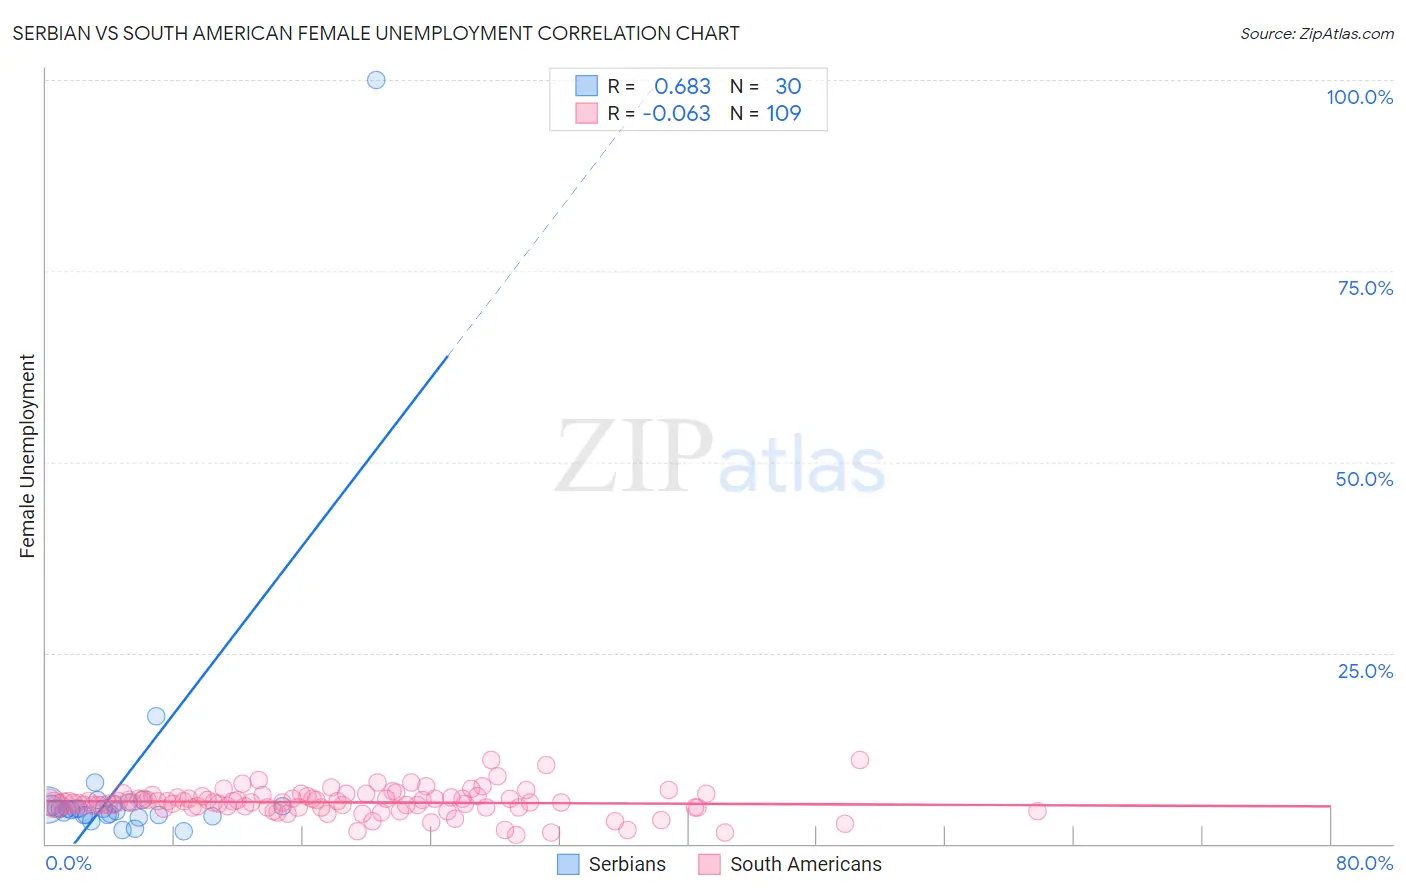
Serbian vs South American Female Unemployment Correlation Chart
The statistical analysis conducted on geographies consisting of 266,650,346 people shows a significant positive correlation between the proportion of Serbians and unemploymnet rate among females in the United States with a correlation coefficient (R) of 0.683 and weighted average of 4.9%. Similarly, the statistical analysis conducted on geographies consisting of 490,205,488 people shows a slight negative correlation between the proportion of South Americans and unemploymnet rate among females in the United States with a correlation coefficient (R) of -0.063 and weighted average of 5.4%, a difference of 11.2%.
Female Unemployment Correlation Summary
| Measurement | Serbian | South American |
| Minimum | 1.7% | 1.2% |
| Maximum | 100.0% | 11.0% |
| Range | 98.3% | 9.8% |
| Mean | 7.9% | 5.4% |
| Median | 4.6% | 5.4% |
| Interquartile 25% (IQ1) | 3.7% | 4.8% |
| Interquartile 75% (IQ3) | 5.1% | 6.1% |
| Interquartile Range (IQR) | 1.4% | 1.4% |
| Standard Deviation (Sample) | 17.6% | 1.7% |
| Standard Deviation (Population) | 17.3% | 1.7% |
Similar Demographics by Female Unemployment
Demographics Similar to Serbians by Female Unemployment
In terms of female unemployment, the demographic groups most similar to Serbians are Immigrants from Moldova (4.9%, a difference of 0.020%), Immigrants from Zimbabwe (4.9%, a difference of 0.030%), White/Caucasian (4.9%, a difference of 0.090%), Slavic (4.9%, a difference of 0.12%), and Cambodian (4.9%, a difference of 0.14%).
| Demographics | Rating | Rank | Female Unemployment |
| Australians | 99.2 /100 | #49 | Exceptional 4.9% |
| Immigrants | Cuba | 99.1 /100 | #50 | Exceptional 4.9% |
| Cambodians | 99.1 /100 | #51 | Exceptional 4.9% |
| Slavs | 99.1 /100 | #52 | Exceptional 4.9% |
| Whites/Caucasians | 99.0 /100 | #53 | Exceptional 4.9% |
| Immigrants | Zimbabwe | 99.0 /100 | #54 | Exceptional 4.9% |
| Immigrants | Moldova | 99.0 /100 | #55 | Exceptional 4.9% |
| Serbians | 99.0 /100 | #56 | Exceptional 4.9% |
| Icelanders | 98.8 /100 | #57 | Exceptional 4.9% |
| Immigrants | Lithuania | 98.8 /100 | #58 | Exceptional 4.9% |
| Bhutanese | 98.7 /100 | #59 | Exceptional 4.9% |
| Immigrants | Scotland | 98.6 /100 | #60 | Exceptional 4.9% |
| Immigrants | Canada | 98.6 /100 | #61 | Exceptional 4.9% |
| Immigrants | Nepal | 98.6 /100 | #62 | Exceptional 4.9% |
| Immigrants | Belgium | 98.5 /100 | #63 | Exceptional 4.9% |
Demographics Similar to South Americans by Female Unemployment
In terms of female unemployment, the demographic groups most similar to South Americans are Immigrants from Africa (5.4%, a difference of 0.010%), Bermudan (5.4%, a difference of 0.070%), Peruvian (5.4%, a difference of 0.17%), Comanche (5.4%, a difference of 0.24%), and Brazilian (5.5%, a difference of 0.26%).
| Demographics | Rating | Rank | Female Unemployment |
| Uruguayans | 11.4 /100 | #212 | Poor 5.4% |
| Samoans | 10.6 /100 | #213 | Poor 5.4% |
| Seminole | 10.3 /100 | #214 | Poor 5.4% |
| Immigrants | Nicaragua | 10.2 /100 | #215 | Poor 5.4% |
| Comanche | 10.0 /100 | #216 | Poor 5.4% |
| Peruvians | 9.6 /100 | #217 | Tragic 5.4% |
| Bermudans | 9.0 /100 | #218 | Tragic 5.4% |
| South Americans | 8.6 /100 | #219 | Tragic 5.4% |
| Immigrants | Africa | 8.5 /100 | #220 | Tragic 5.4% |
| Brazilians | 7.3 /100 | #221 | Tragic 5.5% |
| Nicaraguans | 7.2 /100 | #222 | Tragic 5.5% |
| Delaware | 7.2 /100 | #223 | Tragic 5.5% |
| Iraqis | 7.1 /100 | #224 | Tragic 5.5% |
| French American Indians | 6.1 /100 | #225 | Tragic 5.5% |
| Immigrants | Peru | 5.9 /100 | #226 | Tragic 5.5% |