American vs South American Female Unemployment
COMPARE
American
South American
Female Unemployment
Female Unemployment Comparison
Americans
South Americans
5.1%
FEMALE UNEMPLOYMENT
90.5/ 100
METRIC RATING
116th/ 347
METRIC RANK
5.4%
FEMALE UNEMPLOYMENT
8.6/ 100
METRIC RATING
219th/ 347
METRIC RANK
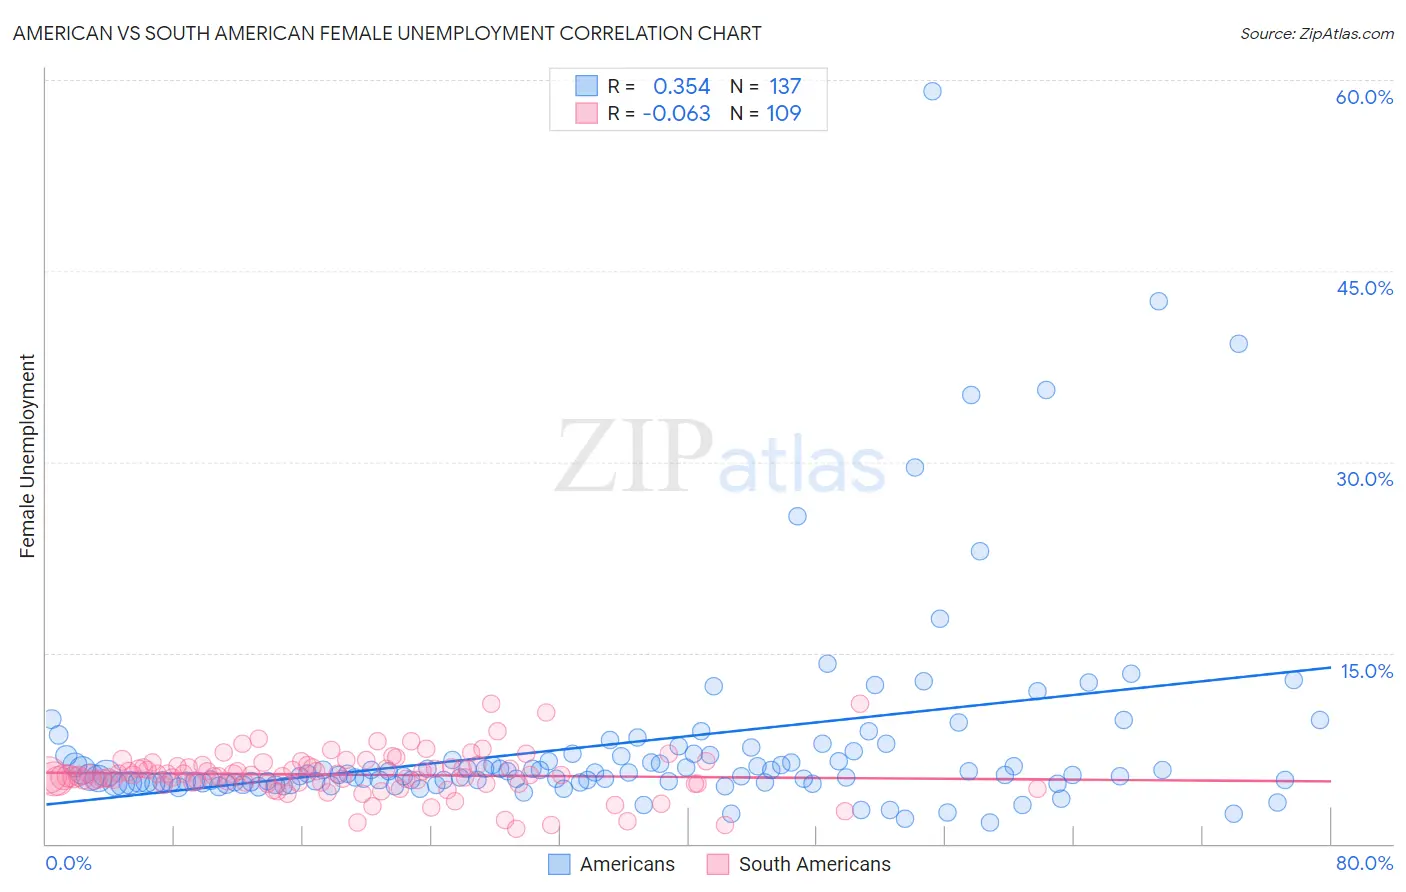
American vs South American Female Unemployment Correlation Chart
The statistical analysis conducted on geographies consisting of 565,732,279 people shows a mild positive correlation between the proportion of Americans and unemploymnet rate among females in the United States with a correlation coefficient (R) of 0.354 and weighted average of 5.1%. Similarly, the statistical analysis conducted on geographies consisting of 490,205,488 people shows a slight negative correlation between the proportion of South Americans and unemploymnet rate among females in the United States with a correlation coefficient (R) of -0.063 and weighted average of 5.4%, a difference of 7.2%.
Female Unemployment Correlation Summary
| Measurement | American | South American |
| Minimum | 1.7% | 1.2% |
| Maximum | 59.1% | 11.0% |
| Range | 57.4% | 9.8% |
| Mean | 7.8% | 5.4% |
| Median | 5.4% | 5.4% |
| Interquartile 25% (IQ1) | 4.8% | 4.8% |
| Interquartile 75% (IQ3) | 6.9% | 6.1% |
| Interquartile Range (IQR) | 2.1% | 1.4% |
| Standard Deviation (Sample) | 8.0% | 1.7% |
| Standard Deviation (Population) | 7.9% | 1.7% |
Similar Demographics by Female Unemployment
Demographics Similar to Americans by Female Unemployment
In terms of female unemployment, the demographic groups most similar to Americans are Jordanian (5.1%, a difference of 0.040%), Lebanese (5.1%, a difference of 0.080%), Immigrants from Turkey (5.1%, a difference of 0.10%), Immigrants from Croatia (5.1%, a difference of 0.11%), and Immigrants from Saudi Arabia (5.1%, a difference of 0.13%).
| Demographics | Rating | Rank | Female Unemployment |
| Immigrants | Eastern Africa | 92.8 /100 | #109 | Exceptional 5.1% |
| Macedonians | 92.4 /100 | #110 | Exceptional 5.1% |
| Immigrants | Burma/Myanmar | 92.3 /100 | #111 | Exceptional 5.1% |
| Estonians | 92.1 /100 | #112 | Exceptional 5.1% |
| Immigrants | Saudi Arabia | 91.2 /100 | #113 | Exceptional 5.1% |
| Immigrants | Turkey | 91.0 /100 | #114 | Exceptional 5.1% |
| Lebanese | 91.0 /100 | #115 | Exceptional 5.1% |
| Americans | 90.5 /100 | #116 | Exceptional 5.1% |
| Jordanians | 90.3 /100 | #117 | Exceptional 5.1% |
| Immigrants | Croatia | 89.9 /100 | #118 | Excellent 5.1% |
| Immigrants | North Macedonia | 88.3 /100 | #119 | Excellent 5.1% |
| Immigrants | Romania | 88.1 /100 | #120 | Excellent 5.1% |
| Immigrants | Western Europe | 88.1 /100 | #121 | Excellent 5.1% |
| Immigrants | Germany | 87.6 /100 | #122 | Excellent 5.1% |
| Immigrants | South Africa | 87.6 /100 | #123 | Excellent 5.1% |
Demographics Similar to South Americans by Female Unemployment
In terms of female unemployment, the demographic groups most similar to South Americans are Immigrants from Africa (5.4%, a difference of 0.010%), Bermudan (5.4%, a difference of 0.070%), Peruvian (5.4%, a difference of 0.17%), Comanche (5.4%, a difference of 0.24%), and Brazilian (5.5%, a difference of 0.26%).
| Demographics | Rating | Rank | Female Unemployment |
| Uruguayans | 11.4 /100 | #212 | Poor 5.4% |
| Samoans | 10.6 /100 | #213 | Poor 5.4% |
| Seminole | 10.3 /100 | #214 | Poor 5.4% |
| Immigrants | Nicaragua | 10.2 /100 | #215 | Poor 5.4% |
| Comanche | 10.0 /100 | #216 | Poor 5.4% |
| Peruvians | 9.6 /100 | #217 | Tragic 5.4% |
| Bermudans | 9.0 /100 | #218 | Tragic 5.4% |
| South Americans | 8.6 /100 | #219 | Tragic 5.4% |
| Immigrants | Africa | 8.5 /100 | #220 | Tragic 5.4% |
| Brazilians | 7.3 /100 | #221 | Tragic 5.5% |
| Nicaraguans | 7.2 /100 | #222 | Tragic 5.5% |
| Delaware | 7.2 /100 | #223 | Tragic 5.5% |
| Iraqis | 7.1 /100 | #224 | Tragic 5.5% |
| French American Indians | 6.1 /100 | #225 | Tragic 5.5% |
| Immigrants | Peru | 5.9 /100 | #226 | Tragic 5.5% |