Serbian vs Mexican American Indian Female Unemployment
COMPARE
Serbian
Mexican American Indian
Female Unemployment
Female Unemployment Comparison
Serbians
Mexican American Indians
4.9%
FEMALE UNEMPLOYMENT
99.0/ 100
METRIC RATING
56th/ 347
METRIC RANK
6.0%
FEMALE UNEMPLOYMENT
0.0/ 100
METRIC RATING
280th/ 347
METRIC RANK
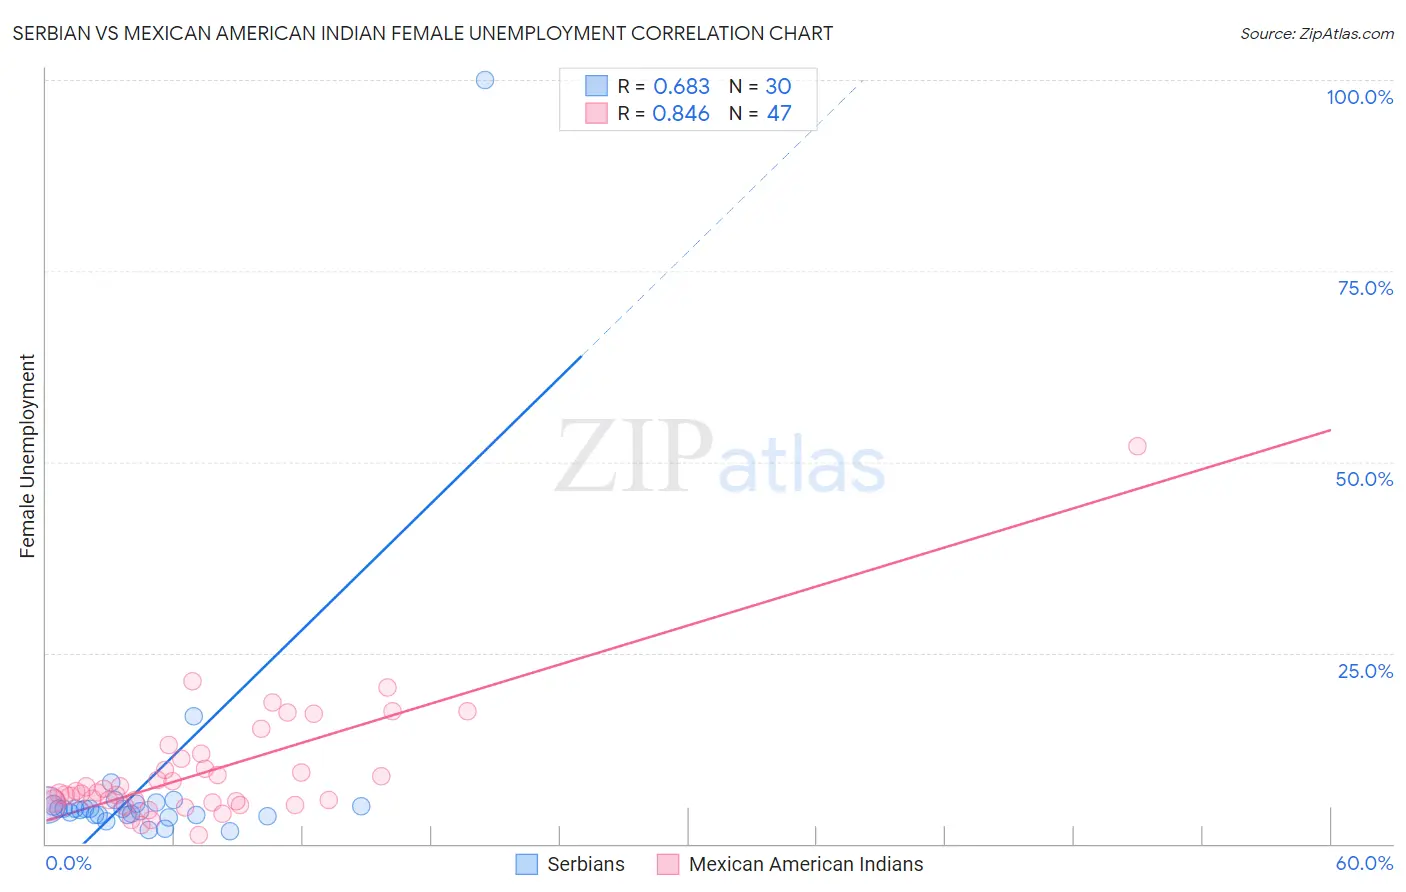
Serbian vs Mexican American Indian Female Unemployment Correlation Chart
The statistical analysis conducted on geographies consisting of 266,650,346 people shows a significant positive correlation between the proportion of Serbians and unemploymnet rate among females in the United States with a correlation coefficient (R) of 0.683 and weighted average of 4.9%. Similarly, the statistical analysis conducted on geographies consisting of 316,627,877 people shows a very strong positive correlation between the proportion of Mexican American Indians and unemploymnet rate among females in the United States with a correlation coefficient (R) of 0.846 and weighted average of 6.0%, a difference of 22.9%.
Female Unemployment Correlation Summary
| Measurement | Serbian | Mexican American Indian |
| Minimum | 1.7% | 1.2% |
| Maximum | 100.0% | 52.0% |
| Range | 98.3% | 50.8% |
| Mean | 7.9% | 9.5% |
| Median | 4.6% | 6.7% |
| Interquartile 25% (IQ1) | 3.7% | 5.3% |
| Interquartile 75% (IQ3) | 5.1% | 11.2% |
| Interquartile Range (IQR) | 1.4% | 5.9% |
| Standard Deviation (Sample) | 17.6% | 8.0% |
| Standard Deviation (Population) | 17.3% | 8.0% |
Similar Demographics by Female Unemployment
Demographics Similar to Serbians by Female Unemployment
In terms of female unemployment, the demographic groups most similar to Serbians are Immigrants from Moldova (4.9%, a difference of 0.020%), Immigrants from Zimbabwe (4.9%, a difference of 0.030%), White/Caucasian (4.9%, a difference of 0.090%), Slavic (4.9%, a difference of 0.12%), and Cambodian (4.9%, a difference of 0.14%).
| Demographics | Rating | Rank | Female Unemployment |
| Australians | 99.2 /100 | #49 | Exceptional 4.9% |
| Immigrants | Cuba | 99.1 /100 | #50 | Exceptional 4.9% |
| Cambodians | 99.1 /100 | #51 | Exceptional 4.9% |
| Slavs | 99.1 /100 | #52 | Exceptional 4.9% |
| Whites/Caucasians | 99.0 /100 | #53 | Exceptional 4.9% |
| Immigrants | Zimbabwe | 99.0 /100 | #54 | Exceptional 4.9% |
| Immigrants | Moldova | 99.0 /100 | #55 | Exceptional 4.9% |
| Serbians | 99.0 /100 | #56 | Exceptional 4.9% |
| Icelanders | 98.8 /100 | #57 | Exceptional 4.9% |
| Immigrants | Lithuania | 98.8 /100 | #58 | Exceptional 4.9% |
| Bhutanese | 98.7 /100 | #59 | Exceptional 4.9% |
| Immigrants | Scotland | 98.6 /100 | #60 | Exceptional 4.9% |
| Immigrants | Canada | 98.6 /100 | #61 | Exceptional 4.9% |
| Immigrants | Nepal | 98.6 /100 | #62 | Exceptional 4.9% |
| Immigrants | Belgium | 98.5 /100 | #63 | Exceptional 4.9% |
Demographics Similar to Mexican American Indians by Female Unemployment
In terms of female unemployment, the demographic groups most similar to Mexican American Indians are Guatemalan (6.0%, a difference of 0.040%), Armenian (6.0%, a difference of 0.060%), Immigrants from Ghana (6.0%, a difference of 0.17%), Yaqui (6.0%, a difference of 0.17%), and Colville (6.0%, a difference of 0.31%).
| Demographics | Rating | Rank | Female Unemployment |
| Ghanaians | 0.0 /100 | #273 | Tragic 5.9% |
| Africans | 0.0 /100 | #274 | Tragic 5.9% |
| Senegalese | 0.0 /100 | #275 | Tragic 6.0% |
| Bahamians | 0.0 /100 | #276 | Tragic 6.0% |
| Immigrants | Ghana | 0.0 /100 | #277 | Tragic 6.0% |
| Yaqui | 0.0 /100 | #278 | Tragic 6.0% |
| Armenians | 0.0 /100 | #279 | Tragic 6.0% |
| Mexican American Indians | 0.0 /100 | #280 | Tragic 6.0% |
| Guatemalans | 0.0 /100 | #281 | Tragic 6.0% |
| Colville | 0.0 /100 | #282 | Tragic 6.0% |
| Salvadorans | 0.0 /100 | #283 | Tragic 6.0% |
| Immigrants | Senegal | 0.0 /100 | #284 | Tragic 6.1% |
| Immigrants | Cabo Verde | 0.0 /100 | #285 | Tragic 6.1% |
| Chippewa | 0.0 /100 | #286 | Tragic 6.1% |
| Immigrants | Guatemala | 0.0 /100 | #287 | Tragic 6.1% |