Romanian vs South American Female Unemployment
COMPARE
Romanian
South American
Female Unemployment
Female Unemployment Comparison
Romanians
South Americans
5.0%
FEMALE UNEMPLOYMENT
95.9/ 100
METRIC RATING
92nd/ 347
METRIC RANK
5.4%
FEMALE UNEMPLOYMENT
8.6/ 100
METRIC RATING
219th/ 347
METRIC RANK
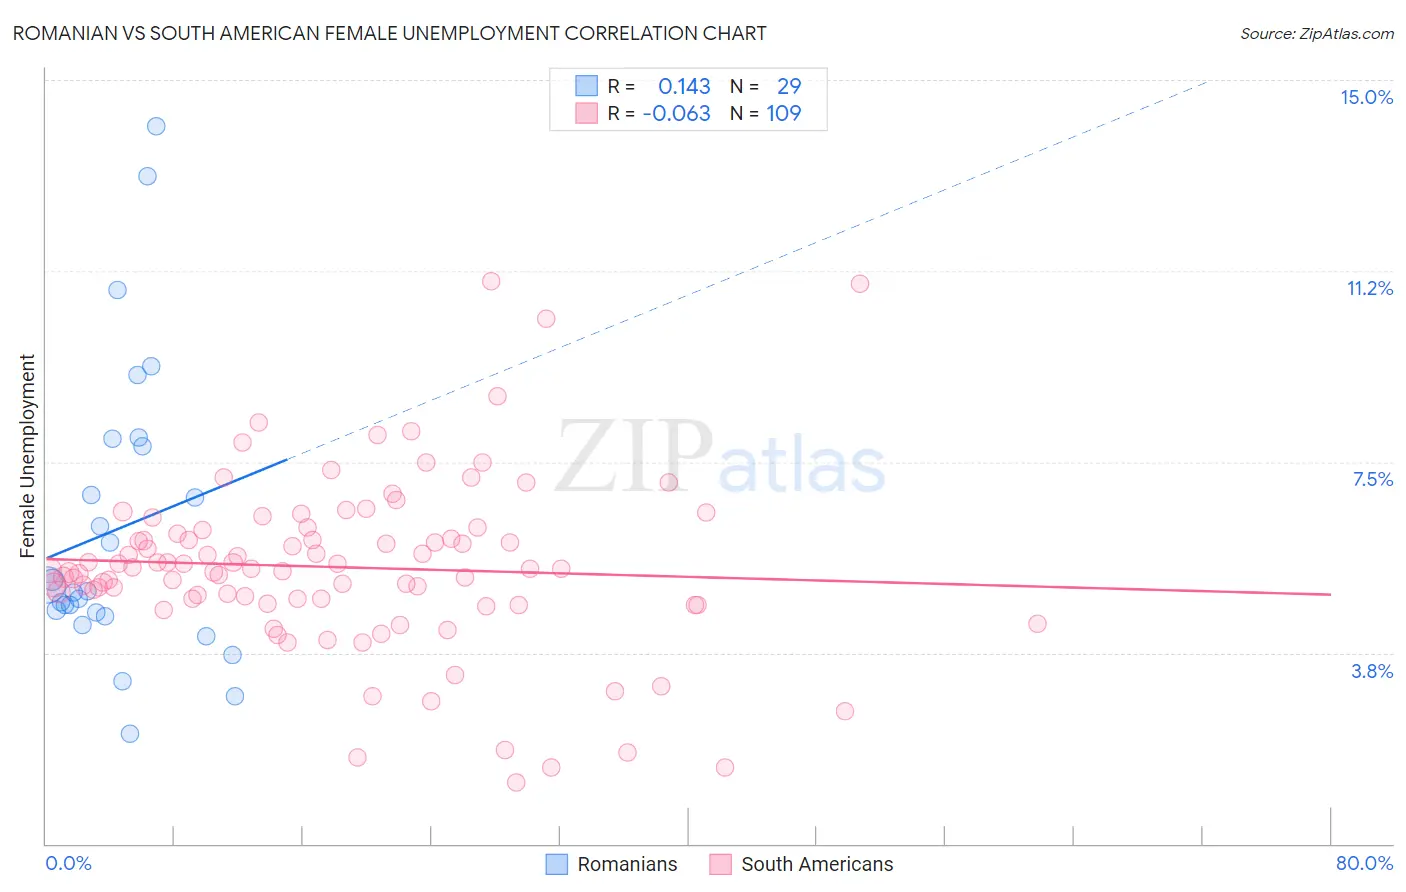
Romanian vs South American Female Unemployment Correlation Chart
The statistical analysis conducted on geographies consisting of 376,152,929 people shows a poor positive correlation between the proportion of Romanians and unemploymnet rate among females in the United States with a correlation coefficient (R) of 0.143 and weighted average of 5.0%. Similarly, the statistical analysis conducted on geographies consisting of 490,205,488 people shows a slight negative correlation between the proportion of South Americans and unemploymnet rate among females in the United States with a correlation coefficient (R) of -0.063 and weighted average of 5.4%, a difference of 8.7%.
Female Unemployment Correlation Summary
| Measurement | Romanian | South American |
| Minimum | 2.1% | 1.2% |
| Maximum | 14.1% | 11.0% |
| Range | 12.0% | 9.8% |
| Mean | 6.2% | 5.4% |
| Median | 5.0% | 5.4% |
| Interquartile 25% (IQ1) | 4.5% | 4.8% |
| Interquartile 75% (IQ3) | 7.9% | 6.1% |
| Interquartile Range (IQR) | 3.4% | 1.4% |
| Standard Deviation (Sample) | 2.9% | 1.7% |
| Standard Deviation (Population) | 2.8% | 1.7% |
Similar Demographics by Female Unemployment
Demographics Similar to Romanians by Female Unemployment
In terms of female unemployment, the demographic groups most similar to Romanians are Immigrants from Japan (5.0%, a difference of 0.030%), Immigrants from Austria (5.0%, a difference of 0.080%), Immigrants from Malaysia (5.0%, a difference of 0.10%), Burmese (5.0%, a difference of 0.12%), and Immigrants from Sweden (5.0%, a difference of 0.14%).
| Demographics | Rating | Rank | Female Unemployment |
| Ukrainians | 97.1 /100 | #85 | Exceptional 5.0% |
| Bolivians | 97.1 /100 | #86 | Exceptional 5.0% |
| Venezuelans | 96.9 /100 | #87 | Exceptional 5.0% |
| Immigrants | Sudan | 96.7 /100 | #88 | Exceptional 5.0% |
| Immigrants | Taiwan | 96.6 /100 | #89 | Exceptional 5.0% |
| Immigrants | Sweden | 96.3 /100 | #90 | Exceptional 5.0% |
| Immigrants | Japan | 96.0 /100 | #91 | Exceptional 5.0% |
| Romanians | 95.9 /100 | #92 | Exceptional 5.0% |
| Immigrants | Austria | 95.7 /100 | #93 | Exceptional 5.0% |
| Immigrants | Malaysia | 95.7 /100 | #94 | Exceptional 5.0% |
| Burmese | 95.6 /100 | #95 | Exceptional 5.0% |
| Immigrants | South Central Asia | 95.5 /100 | #96 | Exceptional 5.0% |
| Immigrants | Somalia | 95.2 /100 | #97 | Exceptional 5.0% |
| Immigrants | Kuwait | 95.2 /100 | #98 | Exceptional 5.0% |
| Immigrants | Zaire | 95.2 /100 | #99 | Exceptional 5.0% |
Demographics Similar to South Americans by Female Unemployment
In terms of female unemployment, the demographic groups most similar to South Americans are Immigrants from Africa (5.4%, a difference of 0.010%), Bermudan (5.4%, a difference of 0.070%), Peruvian (5.4%, a difference of 0.17%), Comanche (5.4%, a difference of 0.24%), and Brazilian (5.5%, a difference of 0.26%).
| Demographics | Rating | Rank | Female Unemployment |
| Uruguayans | 11.4 /100 | #212 | Poor 5.4% |
| Samoans | 10.6 /100 | #213 | Poor 5.4% |
| Seminole | 10.3 /100 | #214 | Poor 5.4% |
| Immigrants | Nicaragua | 10.2 /100 | #215 | Poor 5.4% |
| Comanche | 10.0 /100 | #216 | Poor 5.4% |
| Peruvians | 9.6 /100 | #217 | Tragic 5.4% |
| Bermudans | 9.0 /100 | #218 | Tragic 5.4% |
| South Americans | 8.6 /100 | #219 | Tragic 5.4% |
| Immigrants | Africa | 8.5 /100 | #220 | Tragic 5.4% |
| Brazilians | 7.3 /100 | #221 | Tragic 5.5% |
| Nicaraguans | 7.2 /100 | #222 | Tragic 5.5% |
| Delaware | 7.2 /100 | #223 | Tragic 5.5% |
| Iraqis | 7.1 /100 | #224 | Tragic 5.5% |
| French American Indians | 6.1 /100 | #225 | Tragic 5.5% |
| Immigrants | Peru | 5.9 /100 | #226 | Tragic 5.5% |