Senegalese vs Immigrants from Northern Europe Unemployment Among Ages 45 to 54 years
COMPARE
Senegalese
Immigrants from Northern Europe
Unemployment Among Ages 45 to 54 years
Unemployment Among Ages 45 to 54 years Comparison
Senegalese
Immigrants from Northern Europe
5.1%
UNEMPLOYMENT AMONG AGES 45 TO 54 YEARS
0.0/ 100
METRIC RATING
286th/ 347
METRIC RANK
4.4%
UNEMPLOYMENT AMONG AGES 45 TO 54 YEARS
86.9/ 100
METRIC RATING
128th/ 347
METRIC RANK
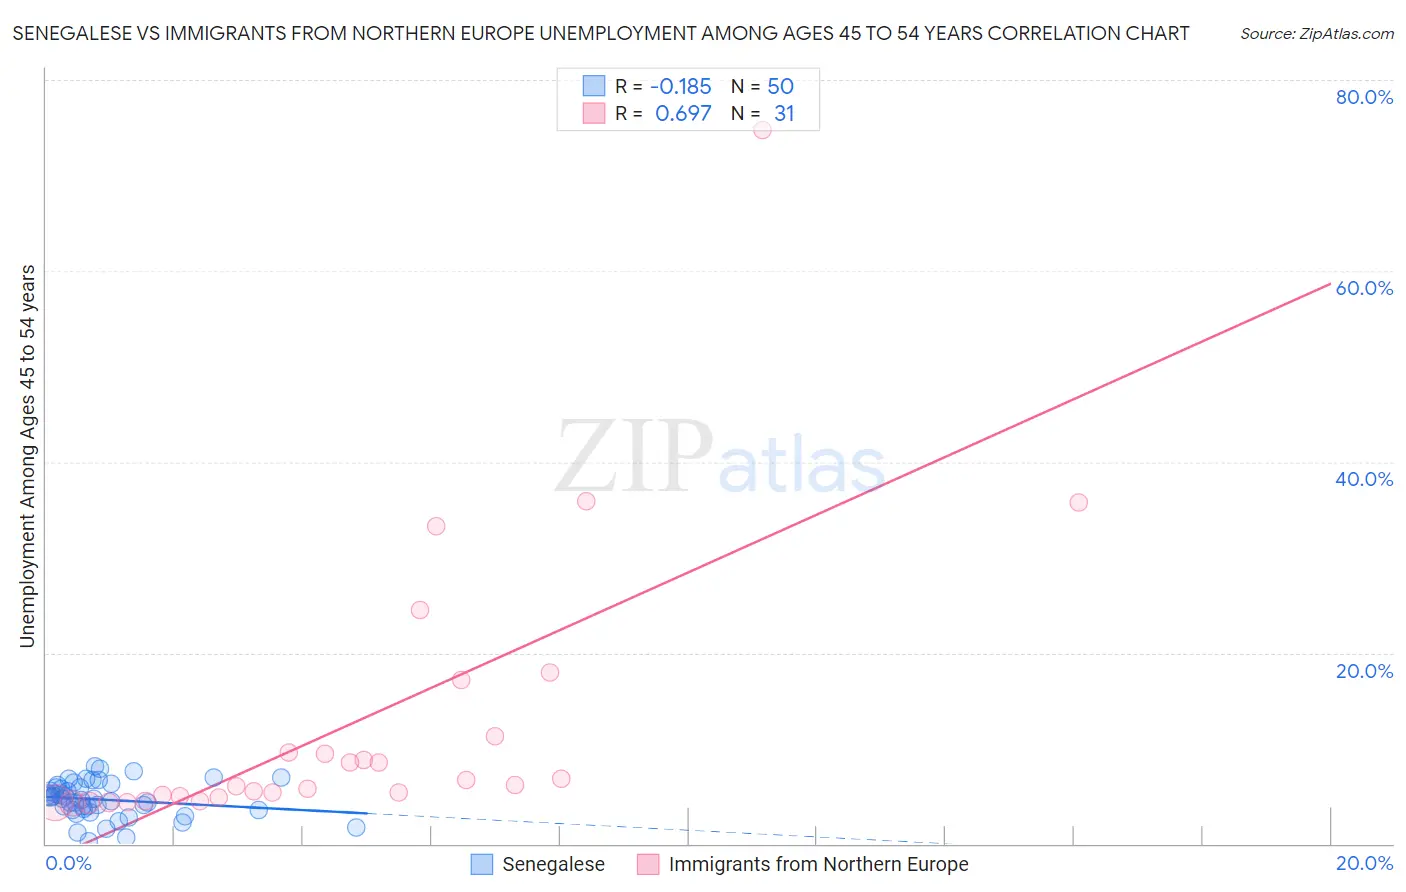
Senegalese vs Immigrants from Northern Europe Unemployment Among Ages 45 to 54 years Correlation Chart
The statistical analysis conducted on geographies consisting of 77,807,393 people shows a poor negative correlation between the proportion of Senegalese and unemployment rate among population between the ages 45 and 54 in the United States with a correlation coefficient (R) of -0.185 and weighted average of 5.1%. Similarly, the statistical analysis conducted on geographies consisting of 458,529,827 people shows a significant positive correlation between the proportion of Immigrants from Northern Europe and unemployment rate among population between the ages 45 and 54 in the United States with a correlation coefficient (R) of 0.697 and weighted average of 4.4%, a difference of 16.0%.
Unemployment Among Ages 45 to 54 years Correlation Summary
| Measurement | Senegalese | Immigrants from Northern Europe |
| Minimum | 0.30% | 4.2% |
| Maximum | 8.1% | 74.7% |
| Range | 7.8% | 70.5% |
| Mean | 4.6% | 12.5% |
| Median | 4.7% | 6.1% |
| Interquartile 25% (IQ1) | 3.6% | 4.9% |
| Interquartile 75% (IQ3) | 5.9% | 11.2% |
| Interquartile Range (IQR) | 2.3% | 6.3% |
| Standard Deviation (Sample) | 1.8% | 14.9% |
| Standard Deviation (Population) | 1.8% | 14.6% |
Similar Demographics by Unemployment Among Ages 45 to 54 years
Demographics Similar to Senegalese by Unemployment Among Ages 45 to 54 years
In terms of unemployment among ages 45 to 54 years, the demographic groups most similar to Senegalese are Iroquois (5.1%, a difference of 0.16%), Kiowa (5.1%, a difference of 0.18%), Hispanic or Latino (5.1%, a difference of 0.83%), Haitian (5.2%, a difference of 0.83%), and Immigrants from Caribbean (5.2%, a difference of 0.91%).
| Demographics | Rating | Rank | Unemployment Among Ages 45 to 54 years |
| Nepalese | 0.0 /100 | #279 | Tragic 5.0% |
| Blackfeet | 0.0 /100 | #280 | Tragic 5.1% |
| Spanish American Indians | 0.0 /100 | #281 | Tragic 5.1% |
| Africans | 0.0 /100 | #282 | Tragic 5.1% |
| Hispanics or Latinos | 0.0 /100 | #283 | Tragic 5.1% |
| Kiowa | 0.0 /100 | #284 | Tragic 5.1% |
| Iroquois | 0.0 /100 | #285 | Tragic 5.1% |
| Senegalese | 0.0 /100 | #286 | Tragic 5.1% |
| Haitians | 0.0 /100 | #287 | Tragic 5.2% |
| Immigrants | Caribbean | 0.0 /100 | #288 | Tragic 5.2% |
| Immigrants | Haiti | 0.0 /100 | #289 | Tragic 5.2% |
| Immigrants | Portugal | 0.0 /100 | #290 | Tragic 5.2% |
| Armenians | 0.0 /100 | #291 | Tragic 5.2% |
| Trinidadians and Tobagonians | 0.0 /100 | #292 | Tragic 5.2% |
| Immigrants | Senegal | 0.0 /100 | #293 | Tragic 5.2% |
Demographics Similar to Immigrants from Northern Europe by Unemployment Among Ages 45 to 54 years
In terms of unemployment among ages 45 to 54 years, the demographic groups most similar to Immigrants from Northern Europe are Laotian (4.4%, a difference of 0.060%), Nicaraguan (4.4%, a difference of 0.080%), Celtic (4.4%, a difference of 0.080%), Immigrants from Czechoslovakia (4.4%, a difference of 0.090%), and Immigrants from Germany (4.4%, a difference of 0.10%).
| Demographics | Rating | Rank | Unemployment Among Ages 45 to 54 years |
| Immigrants | Oceania | 89.5 /100 | #121 | Excellent 4.4% |
| Immigrants | Kazakhstan | 89.5 /100 | #122 | Excellent 4.4% |
| Immigrants | Asia | 88.8 /100 | #123 | Excellent 4.4% |
| Spanish | 88.8 /100 | #124 | Excellent 4.4% |
| Immigrants | Vietnam | 88.6 /100 | #125 | Excellent 4.4% |
| Immigrants | Czechoslovakia | 87.8 /100 | #126 | Excellent 4.4% |
| Nicaraguans | 87.6 /100 | #127 | Excellent 4.4% |
| Immigrants | Northern Europe | 86.9 /100 | #128 | Excellent 4.4% |
| Laotians | 86.3 /100 | #129 | Excellent 4.4% |
| Celtics | 86.2 /100 | #130 | Excellent 4.4% |
| Immigrants | Germany | 85.9 /100 | #131 | Excellent 4.4% |
| Immigrants | Eastern Africa | 85.1 /100 | #132 | Excellent 4.4% |
| Immigrants | Cameroon | 84.8 /100 | #133 | Excellent 4.4% |
| Afghans | 84.6 /100 | #134 | Excellent 4.4% |
| Immigrants | Eastern Asia | 84.0 /100 | #135 | Excellent 4.4% |