Senegalese vs Immigrants from West Indies Unemployment Among Ages 45 to 54 years
COMPARE
Senegalese
Immigrants from West Indies
Unemployment Among Ages 45 to 54 years
Unemployment Among Ages 45 to 54 years Comparison
Senegalese
Immigrants from West Indies
5.1%
UNEMPLOYMENT AMONG AGES 45 TO 54 YEARS
0.0/ 100
METRIC RATING
286th/ 347
METRIC RANK
5.4%
UNEMPLOYMENT AMONG AGES 45 TO 54 YEARS
0.0/ 100
METRIC RATING
305th/ 347
METRIC RANK
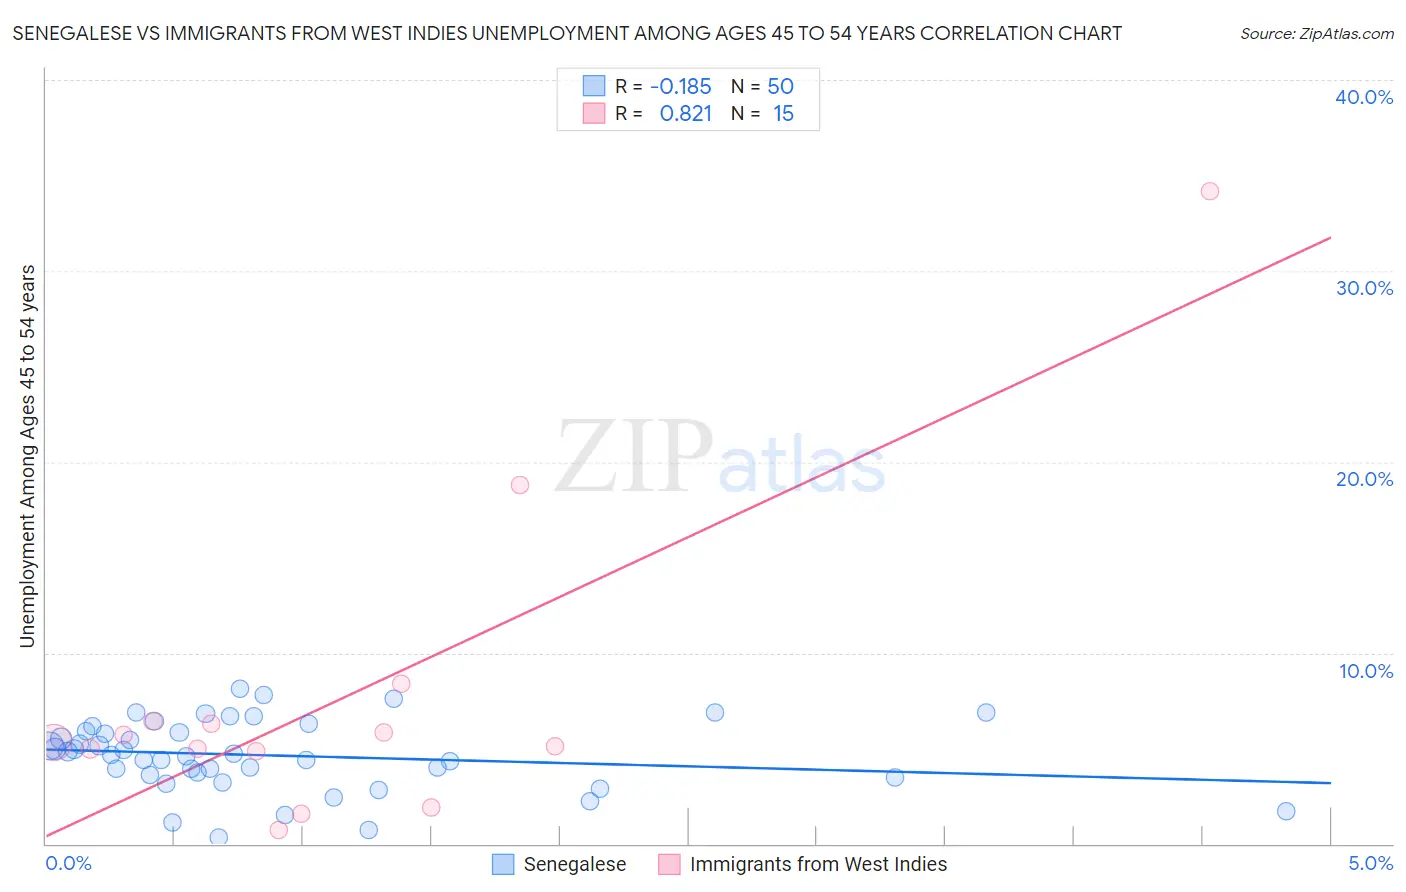
Senegalese vs Immigrants from West Indies Unemployment Among Ages 45 to 54 years Correlation Chart
The statistical analysis conducted on geographies consisting of 77,807,393 people shows a poor negative correlation between the proportion of Senegalese and unemployment rate among population between the ages 45 and 54 in the United States with a correlation coefficient (R) of -0.185 and weighted average of 5.1%. Similarly, the statistical analysis conducted on geographies consisting of 72,252,294 people shows a very strong positive correlation between the proportion of Immigrants from West Indies and unemployment rate among population between the ages 45 and 54 in the United States with a correlation coefficient (R) of 0.821 and weighted average of 5.4%, a difference of 4.6%.
Unemployment Among Ages 45 to 54 years Correlation Summary
| Measurement | Senegalese | Immigrants from West Indies |
| Minimum | 0.30% | 0.71% |
| Maximum | 8.1% | 34.2% |
| Range | 7.8% | 33.5% |
| Mean | 4.6% | 7.7% |
| Median | 4.7% | 5.3% |
| Interquartile 25% (IQ1) | 3.6% | 4.8% |
| Interquartile 75% (IQ3) | 5.9% | 6.4% |
| Interquartile Range (IQR) | 2.3% | 1.6% |
| Standard Deviation (Sample) | 1.8% | 8.4% |
| Standard Deviation (Population) | 1.8% | 8.1% |
Demographics Similar to Senegalese and Immigrants from West Indies by Unemployment Among Ages 45 to 54 years
In terms of unemployment among ages 45 to 54 years, the demographic groups most similar to Senegalese are Iroquois (5.1%, a difference of 0.16%), Haitian (5.2%, a difference of 0.83%), Immigrants from Caribbean (5.2%, a difference of 0.91%), Immigrants from Haiti (5.2%, a difference of 1.3%), and Immigrants from Portugal (5.2%, a difference of 1.5%). Similarly, the demographic groups most similar to Immigrants from West Indies are Immigrants from Jamaica (5.4%, a difference of 0.17%), Immigrants from Belize (5.3%, a difference of 0.35%), Immigrants from Ecuador (5.3%, a difference of 0.45%), Menominee (5.3%, a difference of 1.3%), and Central American Indian (5.3%, a difference of 1.5%).
| Demographics | Rating | Rank | Unemployment Among Ages 45 to 54 years |
| Iroquois | 0.0 /100 | #285 | Tragic 5.1% |
| Senegalese | 0.0 /100 | #286 | Tragic 5.1% |
| Haitians | 0.0 /100 | #287 | Tragic 5.2% |
| Immigrants | Caribbean | 0.0 /100 | #288 | Tragic 5.2% |
| Immigrants | Haiti | 0.0 /100 | #289 | Tragic 5.2% |
| Immigrants | Portugal | 0.0 /100 | #290 | Tragic 5.2% |
| Armenians | 0.0 /100 | #291 | Tragic 5.2% |
| Trinidadians and Tobagonians | 0.0 /100 | #292 | Tragic 5.2% |
| Immigrants | Senegal | 0.0 /100 | #293 | Tragic 5.2% |
| Belizeans | 0.0 /100 | #294 | Tragic 5.2% |
| Jamaicans | 0.0 /100 | #295 | Tragic 5.3% |
| Aleuts | 0.0 /100 | #296 | Tragic 5.3% |
| West Indians | 0.0 /100 | #297 | Tragic 5.3% |
| Immigrants | Trinidad and Tobago | 0.0 /100 | #298 | Tragic 5.3% |
| Ecuadorians | 0.0 /100 | #299 | Tragic 5.3% |
| Central American Indians | 0.0 /100 | #300 | Tragic 5.3% |
| Menominee | 0.0 /100 | #301 | Tragic 5.3% |
| Immigrants | Ecuador | 0.0 /100 | #302 | Tragic 5.3% |
| Immigrants | Belize | 0.0 /100 | #303 | Tragic 5.3% |
| Immigrants | Jamaica | 0.0 /100 | #304 | Tragic 5.4% |
| Immigrants | West Indies | 0.0 /100 | #305 | Tragic 5.4% |