Native Hawaiian vs Ecuadorian Female Unemployment
COMPARE
Native Hawaiian
Ecuadorian
Female Unemployment
Female Unemployment Comparison
Native Hawaiians
Ecuadorians
5.2%
FEMALE UNEMPLOYMENT
62.7/ 100
METRIC RATING
166th/ 347
METRIC RANK
6.3%
FEMALE UNEMPLOYMENT
0.0/ 100
METRIC RATING
309th/ 347
METRIC RANK
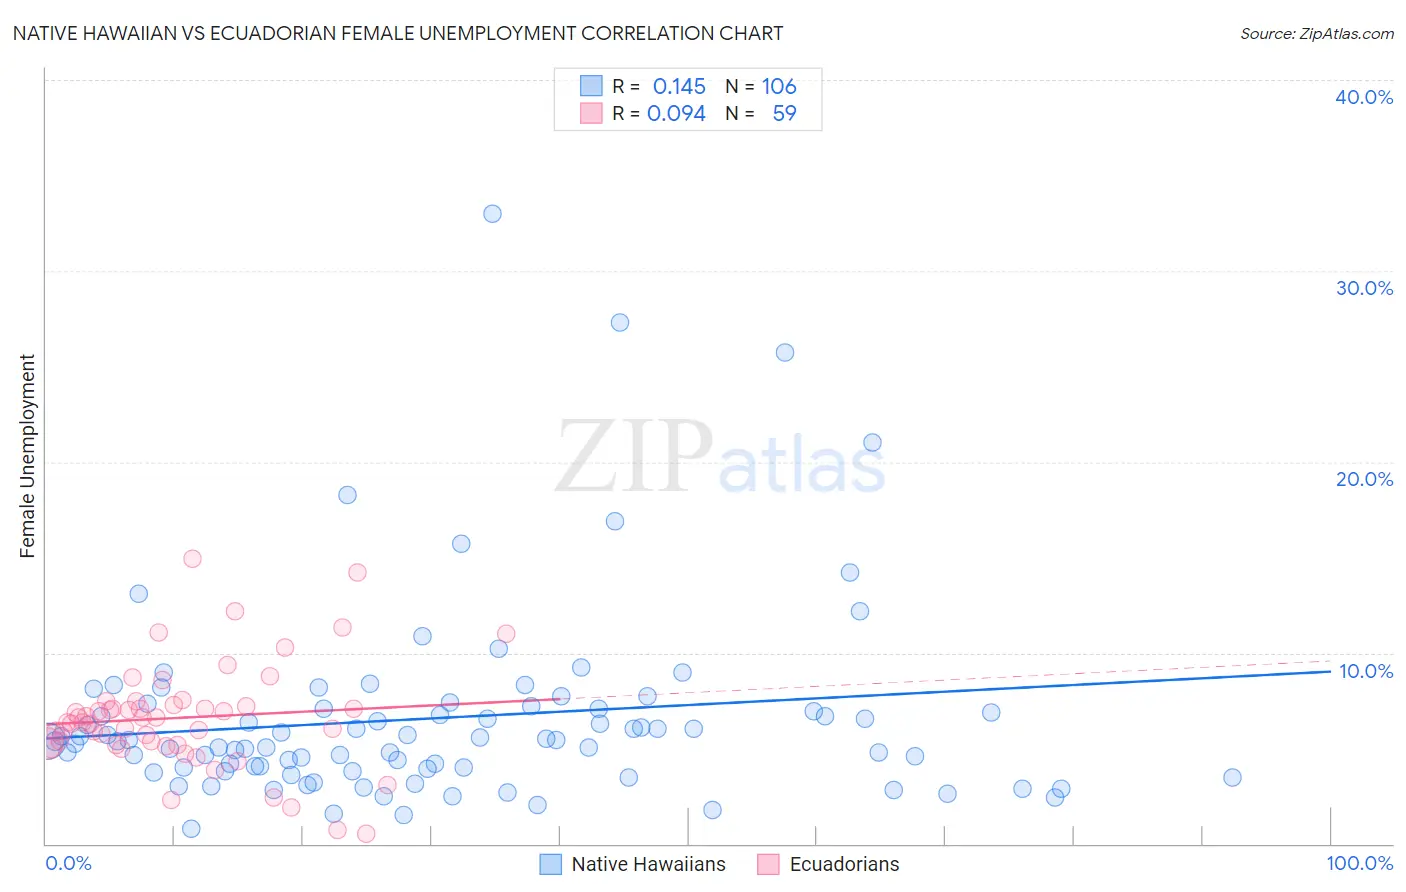
Native Hawaiian vs Ecuadorian Female Unemployment Correlation Chart
The statistical analysis conducted on geographies consisting of 330,662,641 people shows a poor positive correlation between the proportion of Native Hawaiians and unemploymnet rate among females in the United States with a correlation coefficient (R) of 0.145 and weighted average of 5.2%. Similarly, the statistical analysis conducted on geographies consisting of 317,059,726 people shows a slight positive correlation between the proportion of Ecuadorians and unemploymnet rate among females in the United States with a correlation coefficient (R) of 0.094 and weighted average of 6.3%, a difference of 20.2%.
Female Unemployment Correlation Summary
| Measurement | Native Hawaiian | Ecuadorian |
| Minimum | 0.80% | 0.50% |
| Maximum | 33.0% | 14.9% |
| Range | 32.2% | 14.4% |
| Mean | 6.6% | 6.6% |
| Median | 5.4% | 6.4% |
| Interquartile 25% (IQ1) | 4.0% | 5.2% |
| Interquartile 75% (IQ3) | 7.1% | 7.2% |
| Interquartile Range (IQR) | 3.1% | 2.0% |
| Standard Deviation (Sample) | 5.1% | 2.8% |
| Standard Deviation (Population) | 5.1% | 2.7% |
Similar Demographics by Female Unemployment
Demographics Similar to Native Hawaiians by Female Unemployment
In terms of female unemployment, the demographic groups most similar to Native Hawaiians are Syrian (5.2%, a difference of 0.0%), Immigrants from Thailand (5.2%, a difference of 0.040%), Immigrants from Asia (5.2%, a difference of 0.10%), Bangladeshi (5.2%, a difference of 0.10%), and Potawatomi (5.2%, a difference of 0.21%).
| Demographics | Rating | Rank | Female Unemployment |
| Immigrants | Micronesia | 66.9 /100 | #159 | Good 5.2% |
| Immigrants | Spain | 66.8 /100 | #160 | Good 5.2% |
| Immigrants | Pakistan | 66.7 /100 | #161 | Good 5.2% |
| Potawatomi | 65.9 /100 | #162 | Good 5.2% |
| Immigrants | Asia | 64.3 /100 | #163 | Good 5.2% |
| Bangladeshis | 64.3 /100 | #164 | Good 5.2% |
| Syrians | 62.8 /100 | #165 | Good 5.2% |
| Native Hawaiians | 62.7 /100 | #166 | Good 5.2% |
| Immigrants | Thailand | 62.1 /100 | #167 | Good 5.2% |
| Sri Lankans | 59.4 /100 | #168 | Average 5.2% |
| Immigrants | Chile | 59.0 /100 | #169 | Average 5.2% |
| Spanish | 55.9 /100 | #170 | Average 5.2% |
| Immigrants | Denmark | 55.0 /100 | #171 | Average 5.2% |
| Immigrants | Uganda | 50.7 /100 | #172 | Average 5.3% |
| Iranians | 50.4 /100 | #173 | Average 5.3% |
Demographics Similar to Ecuadorians by Female Unemployment
In terms of female unemployment, the demographic groups most similar to Ecuadorians are Central American Indian (6.3%, a difference of 0.41%), Immigrants from Mexico (6.3%, a difference of 0.54%), Hispanic or Latino (6.2%, a difference of 0.58%), Shoshone (6.2%, a difference of 0.64%), and Immigrants from Central America (6.2%, a difference of 0.66%).
| Demographics | Rating | Rank | Female Unemployment |
| U.S. Virgin Islanders | 0.0 /100 | #302 | Tragic 6.2% |
| Barbadians | 0.0 /100 | #303 | Tragic 6.2% |
| Immigrants | Jamaica | 0.0 /100 | #304 | Tragic 6.2% |
| Spanish American Indians | 0.0 /100 | #305 | Tragic 6.2% |
| Immigrants | Central America | 0.0 /100 | #306 | Tragic 6.2% |
| Shoshone | 0.0 /100 | #307 | Tragic 6.2% |
| Hispanics or Latinos | 0.0 /100 | #308 | Tragic 6.2% |
| Ecuadorians | 0.0 /100 | #309 | Tragic 6.3% |
| Central American Indians | 0.0 /100 | #310 | Tragic 6.3% |
| Immigrants | Mexico | 0.0 /100 | #311 | Tragic 6.3% |
| Immigrants | Grenada | 0.0 /100 | #312 | Tragic 6.3% |
| Belizeans | 0.0 /100 | #313 | Tragic 6.3% |
| Immigrants | Ecuador | 0.0 /100 | #314 | Tragic 6.4% |
| Pueblo | 0.0 /100 | #315 | Tragic 6.4% |
| Houma | 0.0 /100 | #316 | Tragic 6.4% |