Guamanian/Chamorro vs Ecuadorian Female Unemployment
COMPARE
Guamanian/Chamorro
Ecuadorian
Female Unemployment
Female Unemployment Comparison
Guamanians/Chamorros
Ecuadorians
5.6%
FEMALE UNEMPLOYMENT
1.4/ 100
METRIC RATING
245th/ 347
METRIC RANK
6.3%
FEMALE UNEMPLOYMENT
0.0/ 100
METRIC RATING
309th/ 347
METRIC RANK
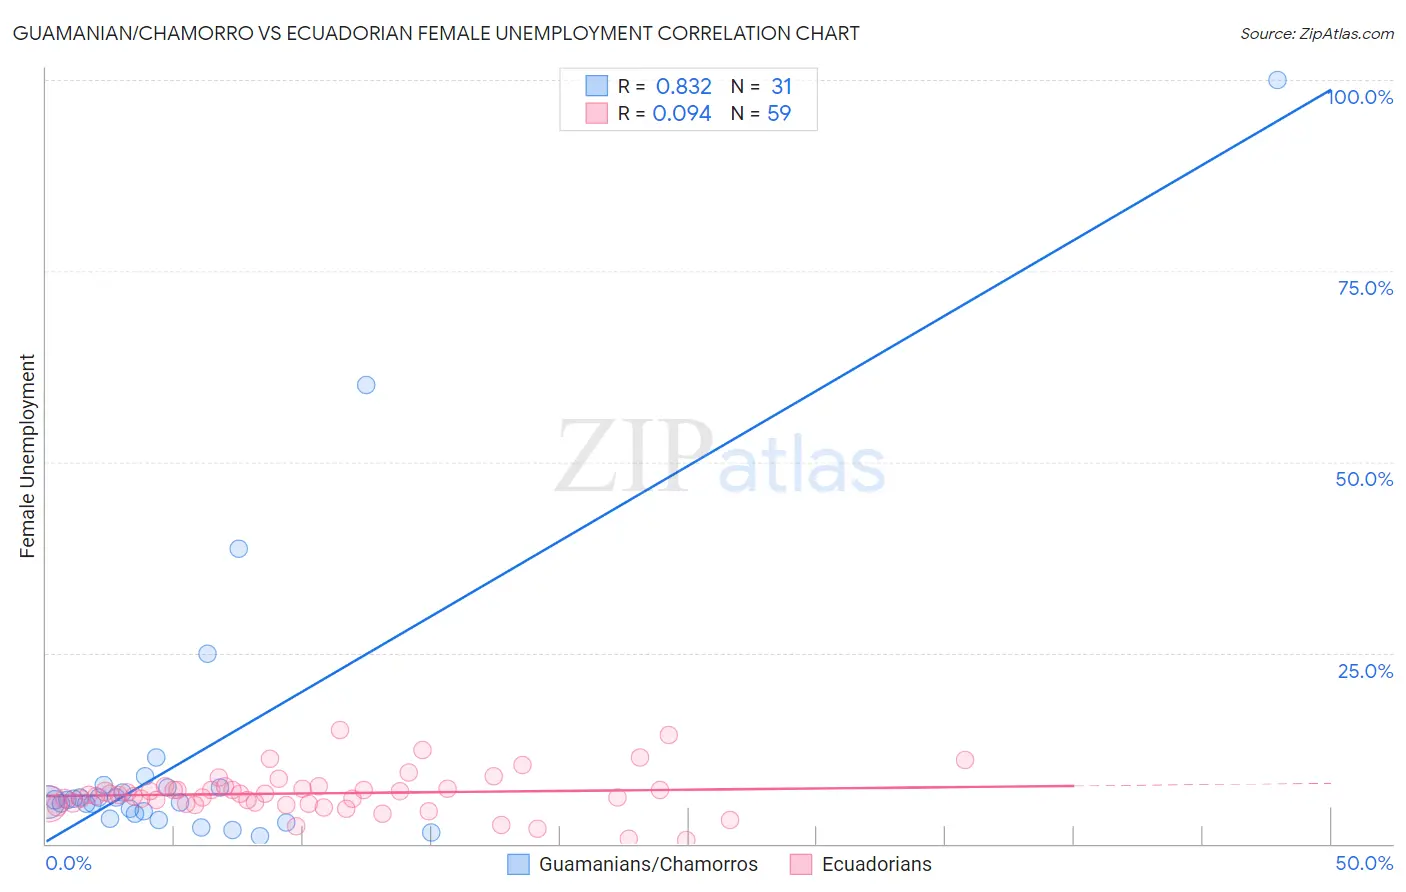
Guamanian/Chamorro vs Ecuadorian Female Unemployment Correlation Chart
The statistical analysis conducted on geographies consisting of 221,394,828 people shows a very strong positive correlation between the proportion of Guamanians/Chamorros and unemploymnet rate among females in the United States with a correlation coefficient (R) of 0.832 and weighted average of 5.6%. Similarly, the statistical analysis conducted on geographies consisting of 317,059,726 people shows a slight positive correlation between the proportion of Ecuadorians and unemploymnet rate among females in the United States with a correlation coefficient (R) of 0.094 and weighted average of 6.3%, a difference of 12.0%.
Female Unemployment Correlation Summary
| Measurement | Guamanian/Chamorro | Ecuadorian |
| Minimum | 1.0% | 0.50% |
| Maximum | 100.0% | 14.9% |
| Range | 99.0% | 14.4% |
| Mean | 11.7% | 6.6% |
| Median | 5.7% | 6.4% |
| Interquartile 25% (IQ1) | 3.9% | 5.2% |
| Interquartile 75% (IQ3) | 7.4% | 7.2% |
| Interquartile Range (IQR) | 3.5% | 2.0% |
| Standard Deviation (Sample) | 20.3% | 2.8% |
| Standard Deviation (Population) | 19.9% | 2.7% |
Similar Demographics by Female Unemployment
Demographics Similar to Guamanians/Chamorros by Female Unemployment
In terms of female unemployment, the demographic groups most similar to Guamanians/Chamorros are Immigrants from Liberia (5.6%, a difference of 0.14%), Japanese (5.6%, a difference of 0.23%), Immigrants from Western Asia (5.6%, a difference of 0.31%), Cree (5.6%, a difference of 0.47%), and Immigrants from Uzbekistan (5.6%, a difference of 0.51%).
| Demographics | Rating | Rank | Female Unemployment |
| Sierra Leoneans | 3.2 /100 | #238 | Tragic 5.5% |
| Aleuts | 3.0 /100 | #239 | Tragic 5.5% |
| Immigrants | South America | 2.9 /100 | #240 | Tragic 5.5% |
| South American Indians | 2.8 /100 | #241 | Tragic 5.5% |
| Marshallese | 2.3 /100 | #242 | Tragic 5.6% |
| Spanish Americans | 2.2 /100 | #243 | Tragic 5.6% |
| Immigrants | Liberia | 1.5 /100 | #244 | Tragic 5.6% |
| Guamanians/Chamorros | 1.4 /100 | #245 | Tragic 5.6% |
| Japanese | 1.2 /100 | #246 | Tragic 5.6% |
| Immigrants | Western Asia | 1.1 /100 | #247 | Tragic 5.6% |
| Cree | 1.0 /100 | #248 | Tragic 5.6% |
| Immigrants | Uzbekistan | 1.0 /100 | #249 | Tragic 5.6% |
| Immigrants | Syria | 0.8 /100 | #250 | Tragic 5.6% |
| Assyrians/Chaldeans/Syriacs | 0.8 /100 | #251 | Tragic 5.6% |
| Cajuns | 0.7 /100 | #252 | Tragic 5.7% |
Demographics Similar to Ecuadorians by Female Unemployment
In terms of female unemployment, the demographic groups most similar to Ecuadorians are Central American Indian (6.3%, a difference of 0.41%), Immigrants from Mexico (6.3%, a difference of 0.54%), Hispanic or Latino (6.2%, a difference of 0.58%), Shoshone (6.2%, a difference of 0.64%), and Immigrants from Central America (6.2%, a difference of 0.66%).
| Demographics | Rating | Rank | Female Unemployment |
| U.S. Virgin Islanders | 0.0 /100 | #302 | Tragic 6.2% |
| Barbadians | 0.0 /100 | #303 | Tragic 6.2% |
| Immigrants | Jamaica | 0.0 /100 | #304 | Tragic 6.2% |
| Spanish American Indians | 0.0 /100 | #305 | Tragic 6.2% |
| Immigrants | Central America | 0.0 /100 | #306 | Tragic 6.2% |
| Shoshone | 0.0 /100 | #307 | Tragic 6.2% |
| Hispanics or Latinos | 0.0 /100 | #308 | Tragic 6.2% |
| Ecuadorians | 0.0 /100 | #309 | Tragic 6.3% |
| Central American Indians | 0.0 /100 | #310 | Tragic 6.3% |
| Immigrants | Mexico | 0.0 /100 | #311 | Tragic 6.3% |
| Immigrants | Grenada | 0.0 /100 | #312 | Tragic 6.3% |
| Belizeans | 0.0 /100 | #313 | Tragic 6.3% |
| Immigrants | Ecuador | 0.0 /100 | #314 | Tragic 6.4% |
| Pueblo | 0.0 /100 | #315 | Tragic 6.4% |
| Houma | 0.0 /100 | #316 | Tragic 6.4% |