Scotch-Irish vs Shoshone Unemployment Among Seniors over 75 years
COMPARE
Scotch-Irish
Shoshone
Unemployment Among Seniors over 75 years
Unemployment Among Seniors over 75 years Comparison
Scotch-Irish
Shoshone
10.0%
UNEMPLOYMENT AMONG SENIORS OVER 75 YEARS
0.0/ 100
METRIC RATING
304th/ 347
METRIC RANK
8.6%
UNEMPLOYMENT AMONG SENIORS OVER 75 YEARS
74.6/ 100
METRIC RATING
159th/ 347
METRIC RANK
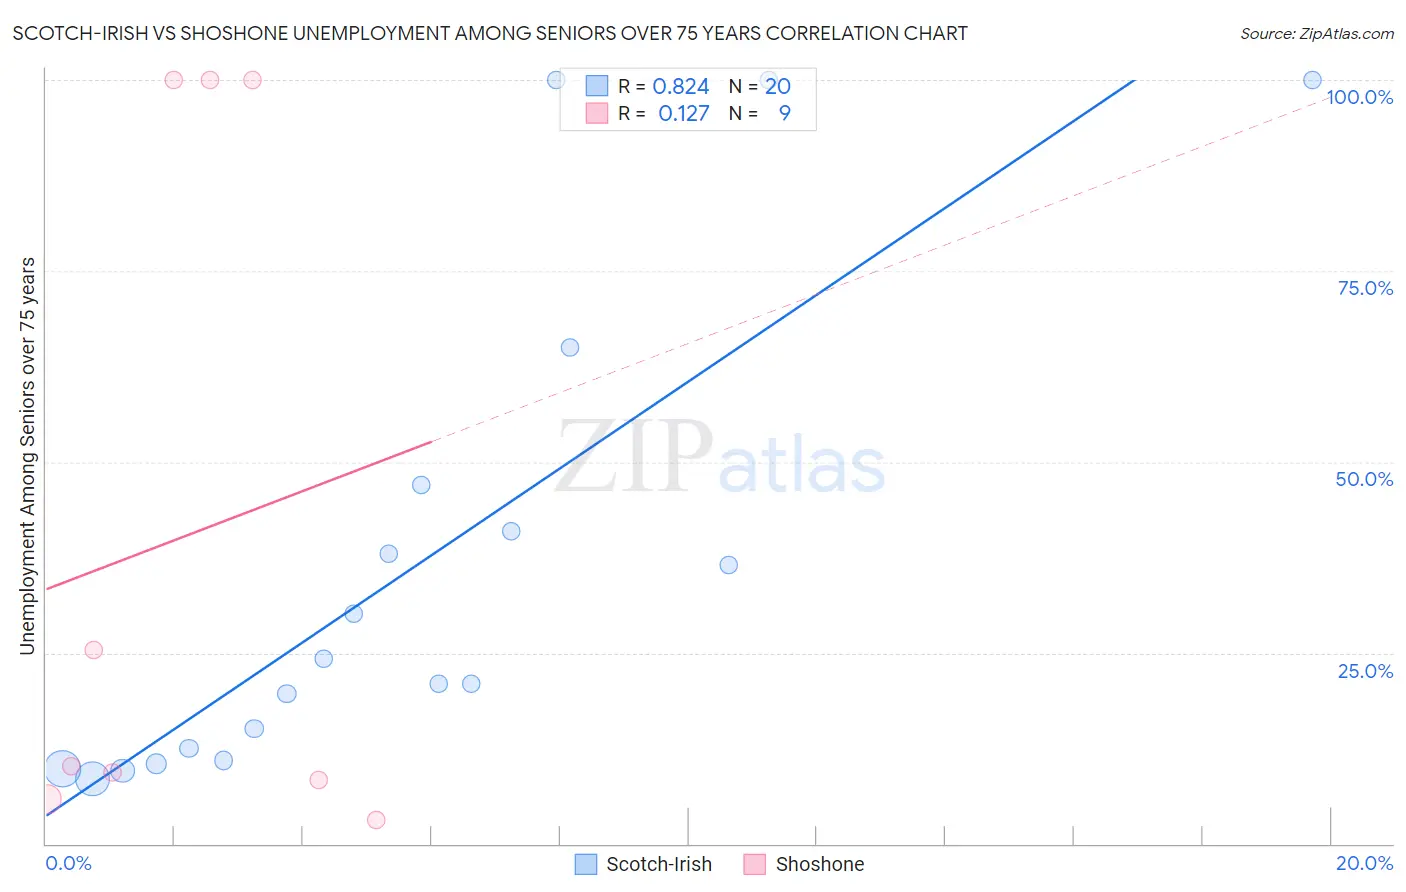
Scotch-Irish vs Shoshone Unemployment Among Seniors over 75 years Correlation Chart
The statistical analysis conducted on geographies consisting of 229,322,772 people shows a very strong positive correlation between the proportion of Scotch-Irish and unemployment rate among seniors over the age of 75 in the United States with a correlation coefficient (R) of 0.824 and weighted average of 10.0%. Similarly, the statistical analysis conducted on geographies consisting of 53,643,040 people shows a poor positive correlation between the proportion of Shoshone and unemployment rate among seniors over the age of 75 in the United States with a correlation coefficient (R) of 0.127 and weighted average of 8.6%, a difference of 15.7%.
Unemployment Among Seniors over 75 years Correlation Summary
| Measurement | Scotch-Irish | Shoshone |
| Minimum | 8.5% | 3.1% |
| Maximum | 100.0% | 100.0% |
| Range | 91.5% | 96.9% |
| Mean | 36.0% | 40.2% |
| Median | 22.6% | 10.1% |
| Interquartile 25% (IQ1) | 11.7% | 7.1% |
| Interquartile 75% (IQ3) | 44.0% | 100.0% |
| Interquartile Range (IQR) | 32.3% | 92.9% |
| Standard Deviation (Sample) | 31.3% | 45.3% |
| Standard Deviation (Population) | 30.5% | 42.7% |
Similar Demographics by Unemployment Among Seniors over 75 years
Demographics Similar to Scotch-Irish by Unemployment Among Seniors over 75 years
In terms of unemployment among seniors over 75 years, the demographic groups most similar to Scotch-Irish are Puget Sound Salish (10.0%, a difference of 0.010%), Finnish (10.0%, a difference of 0.080%), Welsh (10.0%, a difference of 0.19%), Swedish (10.0%, a difference of 0.19%), and Italian (10.0%, a difference of 0.34%).
| Demographics | Rating | Rank | Unemployment Among Seniors over 75 years |
| Cherokee | 0.0 /100 | #297 | Tragic 9.8% |
| Lithuanians | 0.0 /100 | #298 | Tragic 9.9% |
| Belgians | 0.0 /100 | #299 | Tragic 9.9% |
| Iraqis | 0.0 /100 | #300 | Tragic 9.9% |
| Welsh | 0.0 /100 | #301 | Tragic 10.0% |
| Finns | 0.0 /100 | #302 | Tragic 10.0% |
| Puget Sound Salish | 0.0 /100 | #303 | Tragic 10.0% |
| Scotch-Irish | 0.0 /100 | #304 | Tragic 10.0% |
| Swedes | 0.0 /100 | #305 | Tragic 10.0% |
| Italians | 0.0 /100 | #306 | Tragic 10.0% |
| Immigrants | Fiji | 0.0 /100 | #307 | Tragic 10.0% |
| Whites/Caucasians | 0.0 /100 | #308 | Tragic 10.1% |
| English | 0.0 /100 | #309 | Tragic 10.1% |
| Hungarians | 0.0 /100 | #310 | Tragic 10.1% |
| Scottish | 0.0 /100 | #311 | Tragic 10.1% |
Demographics Similar to Shoshone by Unemployment Among Seniors over 75 years
In terms of unemployment among seniors over 75 years, the demographic groups most similar to Shoshone are Ethiopian (8.6%, a difference of 0.050%), Cree (8.6%, a difference of 0.12%), Turkish (8.6%, a difference of 0.13%), Albanian (8.6%, a difference of 0.13%), and Immigrants from Bahamas (8.6%, a difference of 0.14%).
| Demographics | Rating | Rank | Unemployment Among Seniors over 75 years |
| Latvians | 80.5 /100 | #152 | Excellent 8.6% |
| Mongolians | 80.1 /100 | #153 | Excellent 8.6% |
| Immigrants | Pakistan | 79.7 /100 | #154 | Good 8.6% |
| Ecuadorians | 78.5 /100 | #155 | Good 8.6% |
| Immigrants | Bahamas | 76.5 /100 | #156 | Good 8.6% |
| Turks | 76.4 /100 | #157 | Good 8.6% |
| Ethiopians | 75.3 /100 | #158 | Good 8.6% |
| Shoshone | 74.6 /100 | #159 | Good 8.6% |
| Cree | 72.8 /100 | #160 | Good 8.6% |
| Albanians | 72.8 /100 | #161 | Good 8.6% |
| Immigrants | South America | 71.3 /100 | #162 | Good 8.6% |
| Immigrants | Guatemala | 68.4 /100 | #163 | Good 8.7% |
| Paraguayans | 62.2 /100 | #164 | Good 8.7% |
| Immigrants | Dominican Republic | 61.4 /100 | #165 | Good 8.7% |
| Immigrants | Belize | 57.6 /100 | #166 | Average 8.7% |