Scotch-Irish vs Assyrian/Chaldean/Syriac Unemployment Among Seniors over 75 years
COMPARE
Scotch-Irish
Assyrian/Chaldean/Syriac
Unemployment Among Seniors over 75 years
Unemployment Among Seniors over 75 years Comparison
Scotch-Irish
Assyrians/Chaldeans/Syriacs
10.0%
UNEMPLOYMENT AMONG SENIORS OVER 75 YEARS
0.0/ 100
METRIC RATING
304th/ 347
METRIC RANK
11.1%
UNEMPLOYMENT AMONG SENIORS OVER 75 YEARS
0.0/ 100
METRIC RATING
334th/ 347
METRIC RANK
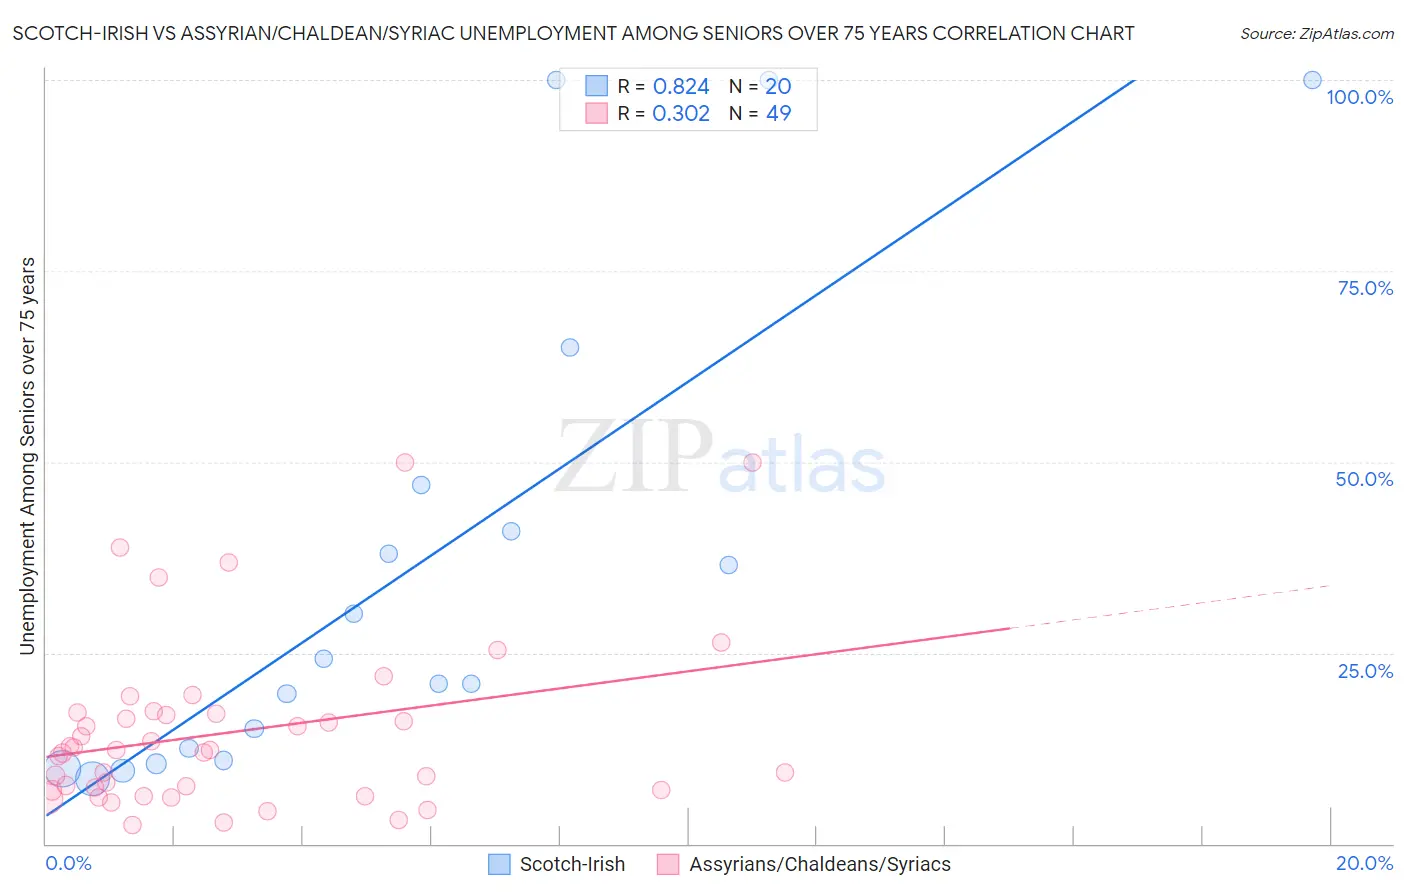
Scotch-Irish vs Assyrian/Chaldean/Syriac Unemployment Among Seniors over 75 years Correlation Chart
The statistical analysis conducted on geographies consisting of 229,322,772 people shows a very strong positive correlation between the proportion of Scotch-Irish and unemployment rate among seniors over the age of 75 in the United States with a correlation coefficient (R) of 0.824 and weighted average of 10.0%. Similarly, the statistical analysis conducted on geographies consisting of 82,071,113 people shows a mild positive correlation between the proportion of Assyrians/Chaldeans/Syriacs and unemployment rate among seniors over the age of 75 in the United States with a correlation coefficient (R) of 0.302 and weighted average of 11.1%, a difference of 10.8%.
Unemployment Among Seniors over 75 years Correlation Summary
| Measurement | Scotch-Irish | Assyrian/Chaldean/Syriac |
| Minimum | 8.5% | 2.4% |
| Maximum | 100.0% | 50.0% |
| Range | 91.5% | 47.6% |
| Mean | 36.0% | 14.6% |
| Median | 22.6% | 12.2% |
| Interquartile 25% (IQ1) | 11.7% | 7.0% |
| Interquartile 75% (IQ3) | 44.0% | 17.2% |
| Interquartile Range (IQR) | 32.3% | 10.2% |
| Standard Deviation (Sample) | 31.3% | 11.1% |
| Standard Deviation (Population) | 30.5% | 11.0% |
Similar Demographics by Unemployment Among Seniors over 75 years
Demographics Similar to Scotch-Irish by Unemployment Among Seniors over 75 years
In terms of unemployment among seniors over 75 years, the demographic groups most similar to Scotch-Irish are Puget Sound Salish (10.0%, a difference of 0.010%), Finnish (10.0%, a difference of 0.080%), Welsh (10.0%, a difference of 0.19%), Swedish (10.0%, a difference of 0.19%), and Italian (10.0%, a difference of 0.34%).
| Demographics | Rating | Rank | Unemployment Among Seniors over 75 years |
| Cherokee | 0.0 /100 | #297 | Tragic 9.8% |
| Lithuanians | 0.0 /100 | #298 | Tragic 9.9% |
| Belgians | 0.0 /100 | #299 | Tragic 9.9% |
| Iraqis | 0.0 /100 | #300 | Tragic 9.9% |
| Welsh | 0.0 /100 | #301 | Tragic 10.0% |
| Finns | 0.0 /100 | #302 | Tragic 10.0% |
| Puget Sound Salish | 0.0 /100 | #303 | Tragic 10.0% |
| Scotch-Irish | 0.0 /100 | #304 | Tragic 10.0% |
| Swedes | 0.0 /100 | #305 | Tragic 10.0% |
| Italians | 0.0 /100 | #306 | Tragic 10.0% |
| Immigrants | Fiji | 0.0 /100 | #307 | Tragic 10.0% |
| Whites/Caucasians | 0.0 /100 | #308 | Tragic 10.1% |
| English | 0.0 /100 | #309 | Tragic 10.1% |
| Hungarians | 0.0 /100 | #310 | Tragic 10.1% |
| Scottish | 0.0 /100 | #311 | Tragic 10.1% |
Demographics Similar to Assyrians/Chaldeans/Syriacs by Unemployment Among Seniors over 75 years
In terms of unemployment among seniors over 75 years, the demographic groups most similar to Assyrians/Chaldeans/Syriacs are Alaskan Athabascan (11.0%, a difference of 0.35%), French Canadian (11.2%, a difference of 1.1%), Immigrants from Liberia (10.9%, a difference of 1.5%), Tohono O'odham (10.8%, a difference of 2.2%), and Immigrants from North Macedonia (11.3%, a difference of 2.3%).
| Demographics | Rating | Rank | Unemployment Among Seniors over 75 years |
| Dutch | 0.0 /100 | #327 | Tragic 10.4% |
| Immigrants | Portugal | 0.0 /100 | #328 | Tragic 10.5% |
| Tsimshian | 0.0 /100 | #329 | Tragic 10.5% |
| Immigrants | Azores | 0.0 /100 | #330 | Tragic 10.7% |
| Tohono O'odham | 0.0 /100 | #331 | Tragic 10.8% |
| Immigrants | Liberia | 0.0 /100 | #332 | Tragic 10.9% |
| Alaskan Athabascans | 0.0 /100 | #333 | Tragic 11.0% |
| Assyrians/Chaldeans/Syriacs | 0.0 /100 | #334 | Tragic 11.1% |
| French Canadians | 0.0 /100 | #335 | Tragic 11.2% |
| Immigrants | North Macedonia | 0.0 /100 | #336 | Tragic 11.3% |
| Cape Verdeans | 0.0 /100 | #337 | Tragic 11.4% |
| Immigrants | Cabo Verde | 0.0 /100 | #338 | Tragic 12.3% |
| Cajuns | 0.0 /100 | #339 | Tragic 12.5% |
| Yup'ik | 0.0 /100 | #340 | Tragic 12.8% |
| Lumbee | 0.0 /100 | #341 | Tragic 13.5% |