Black/African American vs Shoshone Unemployment Among Seniors over 75 years
COMPARE
Black/African American
Shoshone
Unemployment Among Seniors over 75 years
Unemployment Among Seniors over 75 years Comparison
Blacks/African Americans
Shoshone
9.4%
UNEMPLOYMENT AMONG SENIORS OVER 75 YEARS
0.5/ 100
METRIC RATING
266th/ 347
METRIC RANK
8.6%
UNEMPLOYMENT AMONG SENIORS OVER 75 YEARS
74.6/ 100
METRIC RATING
159th/ 347
METRIC RANK
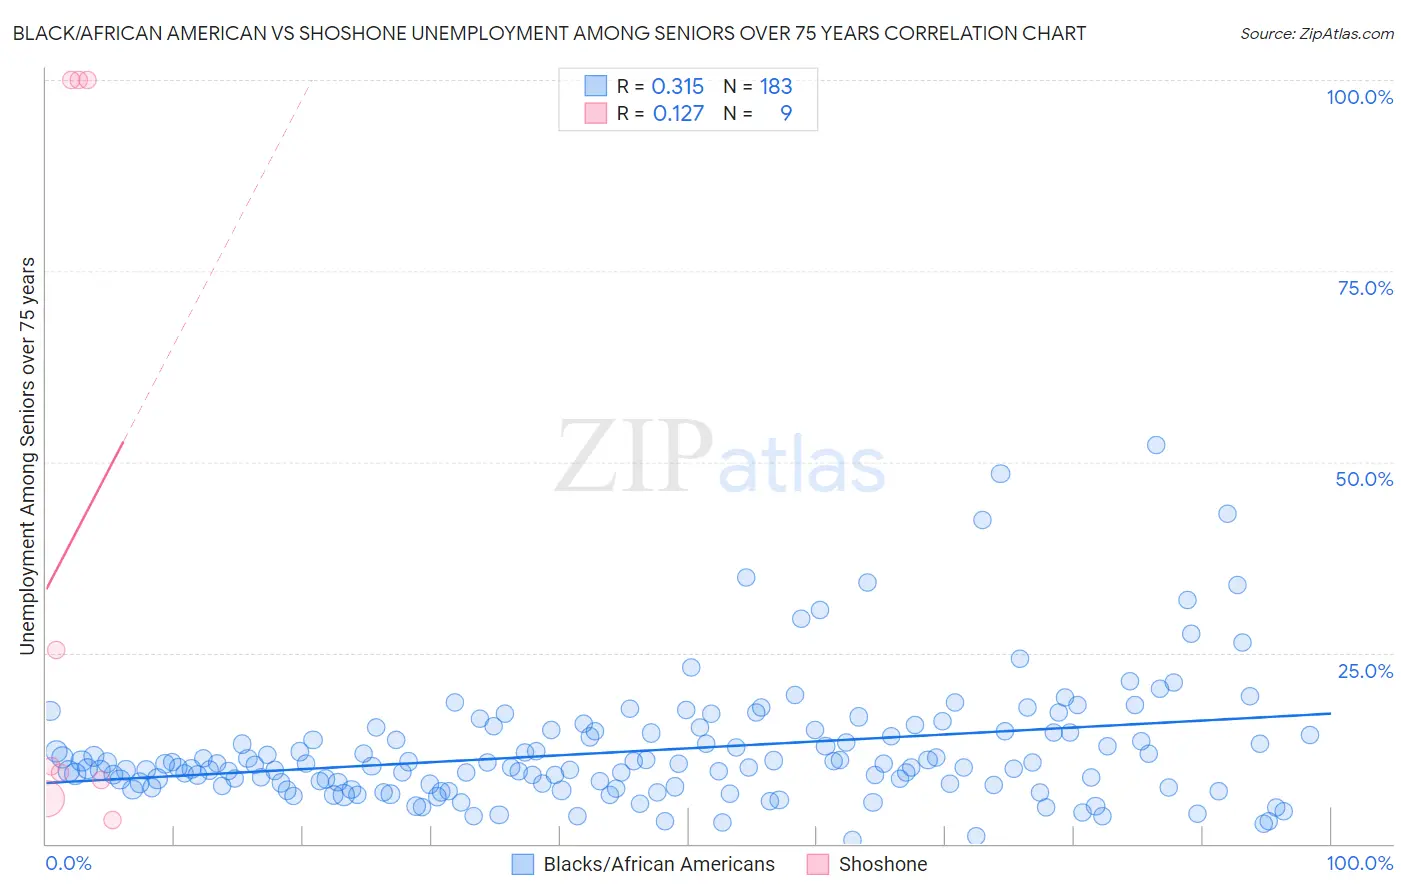
Black/African American vs Shoshone Unemployment Among Seniors over 75 years Correlation Chart
The statistical analysis conducted on geographies consisting of 234,580,439 people shows a mild positive correlation between the proportion of Blacks/African Americans and unemployment rate among seniors over the age of 75 in the United States with a correlation coefficient (R) of 0.315 and weighted average of 9.4%. Similarly, the statistical analysis conducted on geographies consisting of 53,643,040 people shows a poor positive correlation between the proportion of Shoshone and unemployment rate among seniors over the age of 75 in the United States with a correlation coefficient (R) of 0.127 and weighted average of 8.6%, a difference of 8.7%.
Unemployment Among Seniors over 75 years Correlation Summary
| Measurement | Black/African American | Shoshone |
| Minimum | 0.50% | 3.1% |
| Maximum | 52.2% | 100.0% |
| Range | 51.7% | 96.9% |
| Mean | 12.2% | 40.2% |
| Median | 10.2% | 10.1% |
| Interquartile 25% (IQ1) | 7.6% | 7.1% |
| Interquartile 75% (IQ3) | 14.6% | 100.0% |
| Interquartile Range (IQR) | 7.0% | 92.9% |
| Standard Deviation (Sample) | 8.0% | 45.3% |
| Standard Deviation (Population) | 8.0% | 42.7% |
Similar Demographics by Unemployment Among Seniors over 75 years
Demographics Similar to Blacks/African Americans by Unemployment Among Seniors over 75 years
In terms of unemployment among seniors over 75 years, the demographic groups most similar to Blacks/African Americans are Immigrants from Mexico (9.4%, a difference of 0.12%), Greek (9.4%, a difference of 0.28%), Palestinian (9.3%, a difference of 0.32%), Puerto Rican (9.4%, a difference of 0.42%), and Iroquois (9.3%, a difference of 0.45%).
| Demographics | Rating | Rank | Unemployment Among Seniors over 75 years |
| Slovenes | 1.0 /100 | #259 | Tragic 9.3% |
| Immigrants | Cameroon | 1.0 /100 | #260 | Tragic 9.3% |
| Celtics | 0.8 /100 | #261 | Tragic 9.3% |
| Austrians | 0.7 /100 | #262 | Tragic 9.3% |
| Ukrainians | 0.7 /100 | #263 | Tragic 9.3% |
| Iroquois | 0.7 /100 | #264 | Tragic 9.3% |
| Palestinians | 0.6 /100 | #265 | Tragic 9.3% |
| Blacks/African Americans | 0.5 /100 | #266 | Tragic 9.4% |
| Immigrants | Mexico | 0.4 /100 | #267 | Tragic 9.4% |
| Greeks | 0.4 /100 | #268 | Tragic 9.4% |
| Puerto Ricans | 0.3 /100 | #269 | Tragic 9.4% |
| Yaqui | 0.3 /100 | #270 | Tragic 9.4% |
| Bulgarians | 0.3 /100 | #271 | Tragic 9.4% |
| Immigrants | Iraq | 0.3 /100 | #272 | Tragic 9.4% |
| Czechoslovakians | 0.3 /100 | #273 | Tragic 9.4% |
Demographics Similar to Shoshone by Unemployment Among Seniors over 75 years
In terms of unemployment among seniors over 75 years, the demographic groups most similar to Shoshone are Ethiopian (8.6%, a difference of 0.050%), Cree (8.6%, a difference of 0.12%), Turkish (8.6%, a difference of 0.13%), Albanian (8.6%, a difference of 0.13%), and Immigrants from Bahamas (8.6%, a difference of 0.14%).
| Demographics | Rating | Rank | Unemployment Among Seniors over 75 years |
| Latvians | 80.5 /100 | #152 | Excellent 8.6% |
| Mongolians | 80.1 /100 | #153 | Excellent 8.6% |
| Immigrants | Pakistan | 79.7 /100 | #154 | Good 8.6% |
| Ecuadorians | 78.5 /100 | #155 | Good 8.6% |
| Immigrants | Bahamas | 76.5 /100 | #156 | Good 8.6% |
| Turks | 76.4 /100 | #157 | Good 8.6% |
| Ethiopians | 75.3 /100 | #158 | Good 8.6% |
| Shoshone | 74.6 /100 | #159 | Good 8.6% |
| Cree | 72.8 /100 | #160 | Good 8.6% |
| Albanians | 72.8 /100 | #161 | Good 8.6% |
| Immigrants | South America | 71.3 /100 | #162 | Good 8.6% |
| Immigrants | Guatemala | 68.4 /100 | #163 | Good 8.7% |
| Paraguayans | 62.2 /100 | #164 | Good 8.7% |
| Immigrants | Dominican Republic | 61.4 /100 | #165 | Good 8.7% |
| Immigrants | Belize | 57.6 /100 | #166 | Average 8.7% |