Immigrants from Poland vs Shoshone Unemployment Among Seniors over 75 years

COMPARE

Immigrants from Poland
Race
Ancestry
AfghanAfricanAlaska NativeAlaskan AthabascanAlbanianAleutAlsatianAmericanApacheArabArapahoArgentineanArmenianAssyrian/Chaldean/SyriacAustralianAustrianBahamianBangladeshiBarbadianBasqueBelgianBelizeanBermudanBhutaneseBlackfeetBolivianBrazilianBritishBritish West IndianBulgarianBurmeseCajunCambodianCanadianCape VerdeanCarpatho RusynCelticCentral AmericanCentral American IndianCherokeeCheyenneChickasawChileanChineseChippewaChoctawColombianColvilleComancheCosta RicanCreeCreekCroatianCrowCubanCypriotCzechCzechoslovakianDanishDelawareDominicanDutchDutch West IndianEastern EuropeanEcuadorianEgyptianEnglishEstonianEthiopianEuropeanFijianFilipinoFinnishFrenchFrench American IndianFrench CanadianGermanGerman RussianGhanaianGreekGuamanian/ChamorroGuatemalanGuyaneseHaitianHmongHonduranHopiHoumaHungarianIcelanderIndian (Asian)IndonesianInupiatIranianIraqiIrishIroquoisIsraeliItalianJamaicanJapaneseJordanianKenyanKiowaKoreanLaotianLatvianLebaneseLiberianLithuanianLumbeeLuxembourgerMacedonianMalaysianMalteseMarshalleseMexicanMexican American IndianMongolianMoroccanNative HawaiianNavajoNepaleseNew ZealanderNicaraguanNigerianNorthern EuropeanNorwegianOkinawanOsageOttawaPaiutePakistaniPalestinianPanamanianParaguayanPennsylvania GermanPeruvianPimaPolishPortuguesePotawatomiPuebloPuerto RicanPuget Sound SalishRomanianRussianSalvadoranSamoanScandinavianScotch-IrishScottishSeminoleSenegaleseSerbianSierra LeoneanSiouxSlavicSlovakSloveneSomaliSouth AfricanSouth AmericanSouth American IndianSoviet UnionSpaniardSpanishSpanish AmericanSpanish American IndianSri LankanSubsaharan AfricanSudaneseSwedishSwissSyrianTaiwaneseThaiTlingit-HaidaTohono O'OdhamTonganTrinidadian and TobagonianTsimshianTurkishU.S. Virgin IslanderUgandanUkrainianUruguayanUteVenezuelanVietnameseWelshWest IndianYakamaYaquiYugoslavianYumanYup'ikZimbabwean
Immigration
NonimmigrantsImmigrantsAfghanistanAfricaAlbaniaArgentinaArmeniaAsiaAustraliaAustriaBahamasBangladeshBarbadosBelarusBelgiumBelizeBoliviaBosnia and HerzegovinaBrazilBulgariaBurma/MyanmarCabo VerdeCambodiaCameroonCanadaCaribbeanCentral AmericaChileChinaColombiaCongoCosta RicaCroatiaCubaCzechoslovakiaDenmarkDominicaDominican RepublicEastern AfricaEastern AsiaEastern EuropeEcuadorEgyptEl SalvadorEnglandEritreaEthiopiaEuropeFijiFranceGermanyGhanaGreeceGrenadaGuatemalaGuyanaHaitiHondurasHong KongHungaryIndiaIndonesiaIranIraqIrelandIsraelItalyJamaicaJapanJordanKazakhstanKenyaKoreaKuwaitLaosLatin AmericaLatviaLebanonLiberiaLithuaniaMalaysiaMexicoMicronesiaMiddle AfricaMoldovaMoroccoNepalNetherlandsNicaraguaNigeriaNorth AmericaNorth MacedoniaNorthern AfricaNorthern EuropeNorwayOceaniaPakistanPanamaPeruPhilippinesPolandPortugalRomaniaRussiaSaudi ArabiaScotlandSenegalSerbiaSierra LeoneSingaporeSomaliaSouth AfricaSouth AmericaSouth Central AsiaSouth Eastern AsiaSouthern EuropeSpainSri LankaSt. Vincent and the GrenadinesSudanSwedenSwitzerlandSyriaTaiwanThailandTrinidad and TobagoTurkeyUgandaUkraineUruguayUzbekistanVenezuelaVietnamWest IndiesWestern AfricaWestern AsiaWestern EuropeYemenZaireZimbabweAzores
Shoshone
Race
Ancestry
AfghanAfricanAlaska NativeAlaskan AthabascanAlbanianAleutAlsatianAmericanApacheArabArapahoArgentineanArmenianAssyrian/Chaldean/SyriacAustralianAustrianBahamianBangladeshiBarbadianBasqueBelgianBelizeanBermudanBhutaneseBlackfeetBolivianBrazilianBritishBritish West IndianBulgarianBurmeseCajunCambodianCanadianCape VerdeanCarpatho RusynCelticCentral AmericanCentral American IndianCherokeeCheyenneChickasawChileanChineseChippewaChoctawColombianColvilleComancheCosta RicanCreeCreekCroatianCrowCubanCypriotCzechCzechoslovakianDanishDelawareDominicanDutchDutch West IndianEastern EuropeanEcuadorianEgyptianEnglishEstonianEthiopianEuropeanFijianFilipinoFinnishFrenchFrench American IndianFrench CanadianGermanGerman RussianGhanaianGreekGuamanian/ChamorroGuatemalanGuyaneseHaitianHmongHonduranHopiHoumaHungarianIcelanderIndian (Asian)IndonesianInupiatIranianIraqiIrishIroquoisIsraeliItalianJamaicanJapaneseJordanianKenyanKiowaKoreanLaotianLatvianLebaneseLiberianLithuanianLumbeeLuxembourgerMacedonianMalaysianMalteseMarshalleseMexicanMexican American IndianMongolianMoroccanNative HawaiianNavajoNepaleseNew ZealanderNicaraguanNigerianNorthern EuropeanNorwegianOkinawanOsageOttawaPaiutePakistaniPalestinianPanamanianParaguayanPennsylvania GermanPeruvianPimaPolishPortuguesePotawatomiPuebloPuerto RicanPuget Sound SalishRomanianRussianSalvadoranSamoanScandinavianScotch-IrishScottishSeminoleSenegaleseSerbianShoshoneSierra LeoneanSiouxSlavicSlovakSloveneSomaliSouth AfricanSouth AmericanSouth American IndianSoviet UnionSpaniardSpanishSpanish AmericanSpanish American IndianSri LankanSubsaharan AfricanSudaneseSwedishSwissSyrianTaiwaneseThaiTlingit-HaidaTohono O'OdhamTonganTrinidadian and TobagonianTsimshianTurkishU.S. Virgin IslanderUgandanUkrainianUruguayanUteVenezuelanVietnameseWelshWest IndianYakamaYaquiYugoslavianYumanYup'ikZimbabwean
Immigration
NonimmigrantsImmigrantsAfghanistanAfricaAlbaniaArgentinaArmeniaAsiaAustraliaAustriaBahamasBangladeshBarbadosBelarusBelgiumBelizeBoliviaBosnia and HerzegovinaBrazilBulgariaBurma/MyanmarCabo VerdeCambodiaCameroonCanadaCaribbeanCentral AmericaChileChinaColombiaCongoCosta RicaCroatiaCubaCzechoslovakiaDenmarkDominicaDominican RepublicEastern AfricaEastern AsiaEastern EuropeEcuadorEgyptEl SalvadorEnglandEritreaEthiopiaEuropeFijiFranceGermanyGhanaGreeceGrenadaGuatemalaGuyanaHaitiHondurasHong KongHungaryIndiaIndonesiaIranIraqIrelandIsraelItalyJamaicaJapanJordanKazakhstanKenyaKoreaKuwaitLaosLatin AmericaLatviaLebanonLiberiaLithuaniaMalaysiaMexicoMicronesiaMiddle AfricaMoldovaMoroccoNepalNetherlandsNicaraguaNigeriaNorth AmericaNorth MacedoniaNorthern AfricaNorthern EuropeNorwayOceaniaPakistanPanamaPeruPhilippinesPortugalRomaniaRussiaSaudi ArabiaScotlandSenegalSerbiaSierra LeoneSingaporeSomaliaSouth AfricaSouth AmericaSouth Central AsiaSouth Eastern AsiaSouthern EuropeSpainSri LankaSt. Vincent and the GrenadinesSudanSwedenSwitzerlandSyriaTaiwanThailandTrinidad and TobagoTurkeyUgandaUkraineUruguayUzbekistanVenezuelaVietnamWest IndiesWestern AfricaWestern AsiaWestern EuropeYemenZaireZimbabweAzores
Unemployment Among Seniors over 75 years
Income
Poverty
Unemployment
Labor Participation
Family Structure
Vehicle Availability
Education Level
Disability

Unemployment Among Seniors over 75 years Comparison

Immigrants from Poland

Shoshone

Tragic
Good
9.2%
UNEMPLOYMENT AMONG SENIORS OVER 75 YEARS
2.0/ 100
METRIC RATING
251st/ 347
METRIC RANK
8.6%
UNEMPLOYMENT AMONG SENIORS OVER 75 YEARS
74.6/ 100
METRIC RATING
159th/ 347
METRIC RANK

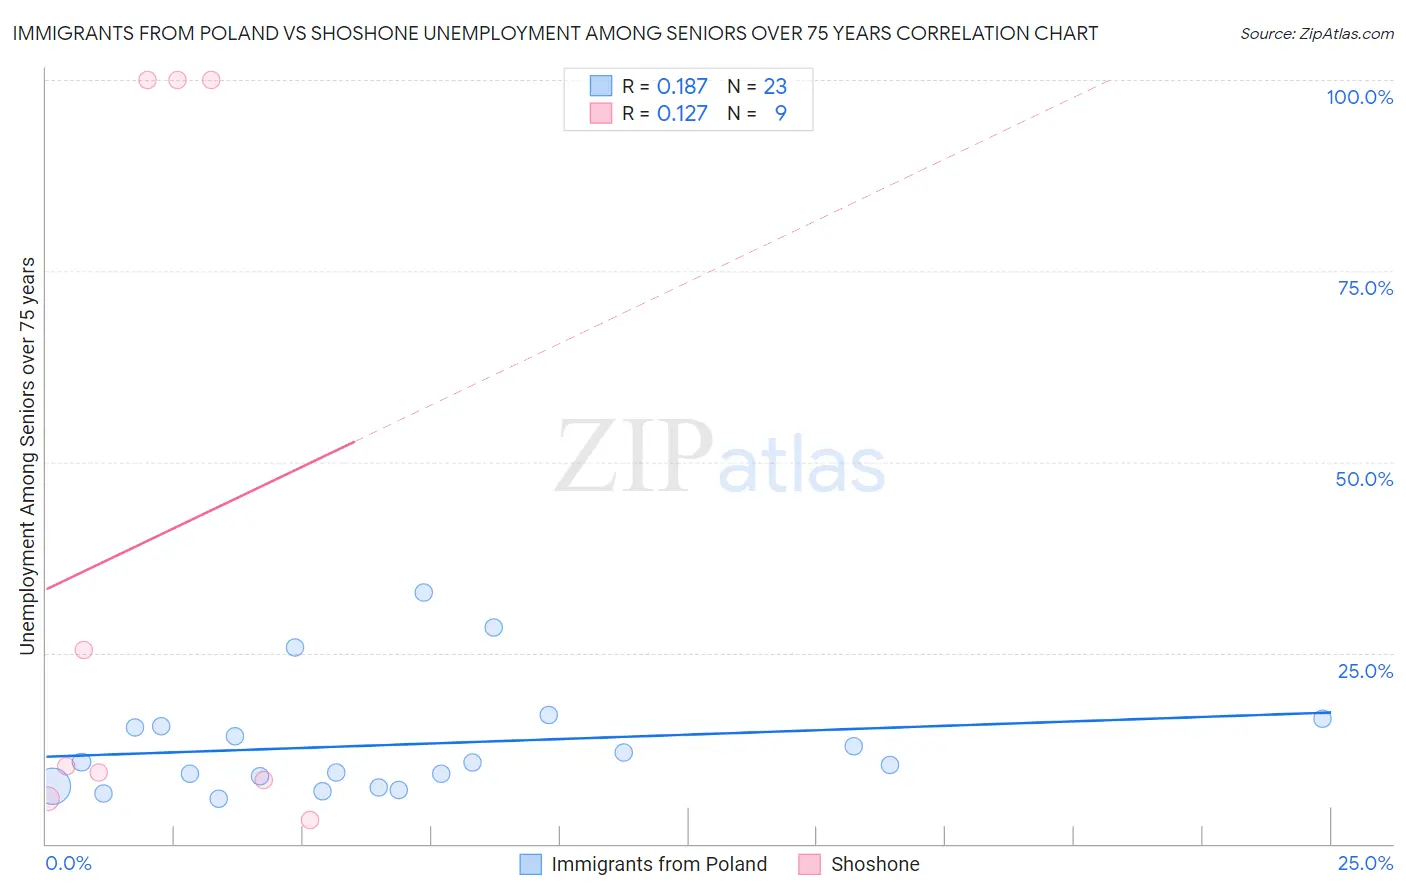
Immigrants from Poland vs Shoshone Unemployment Among Seniors over 75 years Correlation Chart

The statistical analysis conducted on geographies consisting of 170,667,519 people shows a poor positive correlation between the proportion of Immigrants from Poland and unemployment rate among seniors over the age of 75 in the United States with a correlation coefficient (R) of 0.187 and weighted average of 9.2%. Similarly, the statistical analysis conducted on geographies consisting of 53,643,040 people shows a poor positive correlation between the proportion of Shoshone and unemployment rate among seniors over the age of 75 in the United States with a correlation coefficient (R) of 0.127 and weighted average of 8.6%, a difference of 6.7%.
Immigrants from Poland vs Shoshone Unemployment Among Seniors over 75 years

Unemployment Among Seniors over 75 years Correlation Summary

MeasurementImmigrants from PolandShoshone
Minimum5.9%3.1%
Maximum32.9%100.0%
Range27.0%96.9%
Mean13.0%40.2%
Median10.6%10.1%
Interquartile 25% (IQ1)7.6%7.1%
Interquartile 75% (IQ3)15.4%100.0%
Interquartile Range (IQR)7.9%92.9%
Standard Deviation (Sample)7.2%45.3%
Standard Deviation (Population)7.0%42.7%

Similar Demographics by Unemployment Among Seniors over 75 years

Demographics Similar to Immigrants from Poland by Unemployment Among Seniors over 75 years

In terms of unemployment among seniors over 75 years, the demographic groups most similar to Immigrants from Poland are Immigrants from Sudan (9.2%, a difference of 0.030%), Central American Indian (9.2%, a difference of 0.10%), Immigrants from Saudi Arabia (9.2%, a difference of 0.11%), Blackfeet (9.2%, a difference of 0.15%), and Pima (9.2%, a difference of 0.16%).
DemographicsRating | RankUnemployment Among Seniors over 75 years
Immigrants | Germany
2.7
/100
|
#244
Tragic
9.2%
Immigrants | Canada
2.6
/100
|
#245
Tragic
9.2%
Immigrants | North America
2.4
/100
|
#246
Tragic
9.2%
Sub-Saharan Africans
2.3
/100
|
#247
Tragic
9.2%
Blackfeet
2.3
/100
|
#248
Tragic
9.2%
Immigrants | Saudi Arabia
2.2
/100
|
#249
Tragic
9.2%
Central American Indians
2.2
/100
|
#250
Tragic
9.2%
Immigrants | Poland
2.0
/100
|
#251
Tragic
9.2%
Immigrants | Sudan
2.0
/100
|
#252
Tragic
9.2%
Pima
1.8
/100
|
#253
Tragic
9.2%
Immigrants | Ghana
1.7
/100
|
#254
Tragic
9.2%
Immigrants | Scotland
1.4
/100
|
#255
Tragic
9.2%
Brazilians
1.3
/100
|
#256
Tragic
9.3%
Hawaiians
1.2
/100
|
#257
Tragic
9.3%
Immigrants | England
1.0
/100
|
#258
Tragic
9.3%

Demographics Similar to Shoshone by Unemployment Among Seniors over 75 years

In terms of unemployment among seniors over 75 years, the demographic groups most similar to Shoshone are Ethiopian (8.6%, a difference of 0.050%), Cree (8.6%, a difference of 0.12%), Turkish (8.6%, a difference of 0.13%), Albanian (8.6%, a difference of 0.13%), and Immigrants from Bahamas (8.6%, a difference of 0.14%).
DemographicsRating | RankUnemployment Among Seniors over 75 years
Latvians
80.5
/100
|
#152
Excellent
8.6%
Mongolians
80.1
/100
|
#153
Excellent
8.6%
Immigrants | Pakistan
79.7
/100
|
#154
Good
8.6%
Ecuadorians
78.5
/100
|
#155
Good
8.6%
Immigrants | Bahamas
76.5
/100
|
#156
Good
8.6%
Turks
76.4
/100
|
#157
Good
8.6%
Ethiopians
75.3
/100
|
#158
Good
8.6%
Shoshone
74.6
/100
|
#159
Good
8.6%
Cree
72.8
/100
|
#160
Good
8.6%
Albanians
72.8
/100
|
#161
Good
8.6%
Immigrants | South America
71.3
/100
|
#162
Good
8.6%
Immigrants | Guatemala
68.4
/100
|
#163
Good
8.7%
Paraguayans
62.2
/100
|
#164
Good
8.7%
Immigrants | Dominican Republic
61.4
/100
|
#165
Good
8.7%
Immigrants | Belize
57.6
/100
|
#166
Average
8.7%