Carpatho Rusyn vs Shoshone Unemployment Among Seniors over 65 years
COMPARE
Carpatho Rusyn
Shoshone
Unemployment Among Seniors over 65 years
Unemployment Among Seniors over 65 years Comparison
Carpatho Rusyns
Shoshone
4.9%
UNEMPLOYMENT AMONG SENIORS OVER 65 YEARS
99.8/ 100
METRIC RATING
56th/ 347
METRIC RANK
5.9%
UNEMPLOYMENT AMONG SENIORS OVER 65 YEARS
0.0/ 100
METRIC RATING
326th/ 347
METRIC RANK
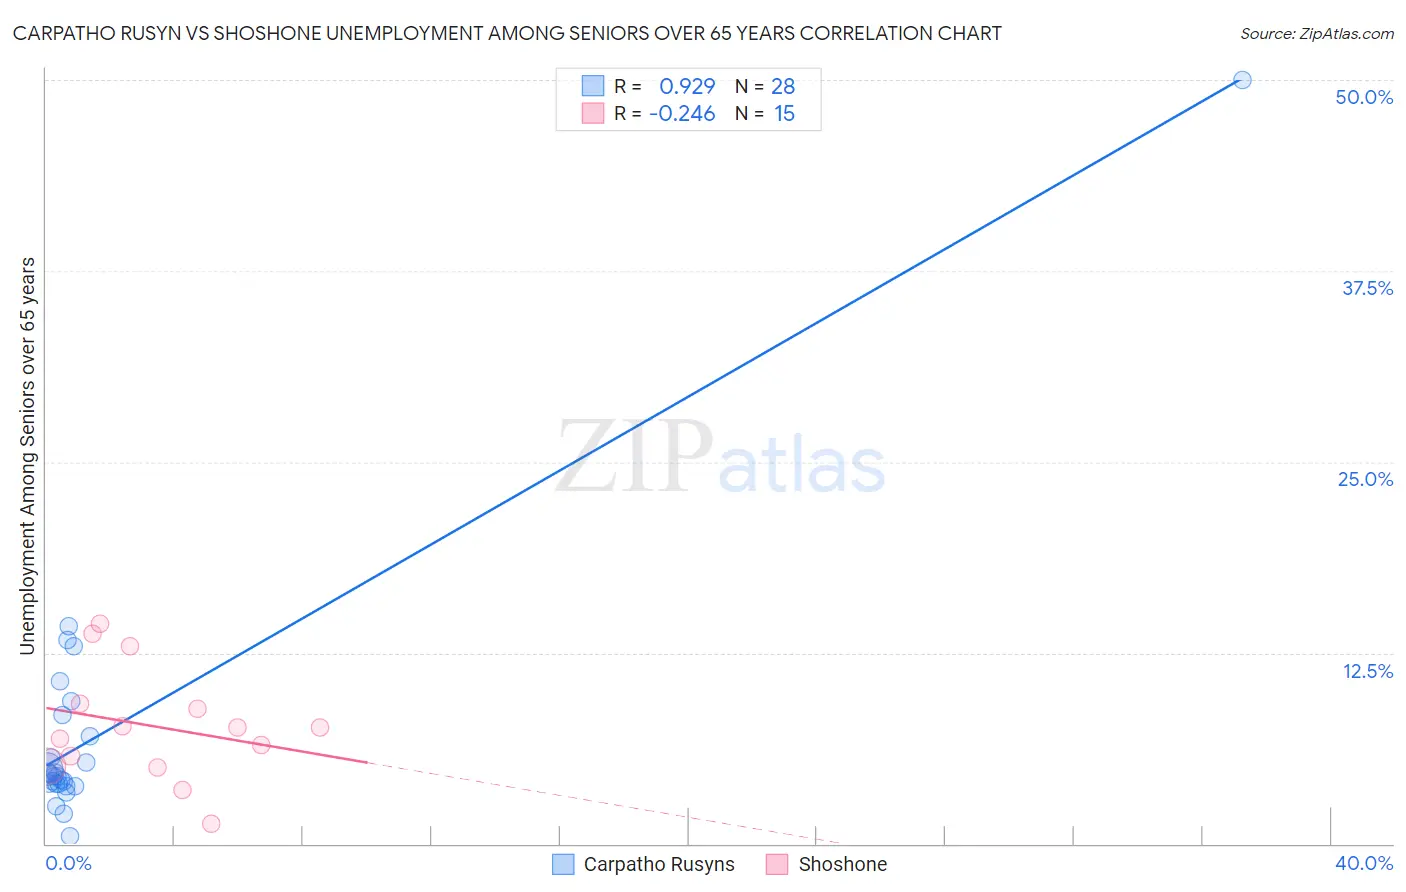
Carpatho Rusyn vs Shoshone Unemployment Among Seniors over 65 years Correlation Chart
The statistical analysis conducted on geographies consisting of 57,331,917 people shows a near-perfect positive correlation between the proportion of Carpatho Rusyns and unemployment rate amomg seniors over the age of 65 in the United States with a correlation coefficient (R) of 0.929 and weighted average of 4.9%. Similarly, the statistical analysis conducted on geographies consisting of 63,830,075 people shows a weak negative correlation between the proportion of Shoshone and unemployment rate amomg seniors over the age of 65 in the United States with a correlation coefficient (R) of -0.246 and weighted average of 5.9%, a difference of 19.9%.
Unemployment Among Seniors over 65 years Correlation Summary
| Measurement | Carpatho Rusyn | Shoshone |
| Minimum | 0.50% | 1.3% |
| Maximum | 50.0% | 14.4% |
| Range | 49.5% | 13.1% |
| Mean | 7.3% | 7.7% |
| Median | 4.5% | 7.6% |
| Interquartile 25% (IQ1) | 3.9% | 5.0% |
| Interquartile 75% (IQ3) | 7.7% | 9.1% |
| Interquartile Range (IQR) | 3.9% | 4.1% |
| Standard Deviation (Sample) | 9.0% | 3.7% |
| Standard Deviation (Population) | 8.9% | 3.6% |
Similar Demographics by Unemployment Among Seniors over 65 years
Demographics Similar to Carpatho Rusyns by Unemployment Among Seniors over 65 years
In terms of unemployment among seniors over 65 years, the demographic groups most similar to Carpatho Rusyns are Danish (4.9%, a difference of 0.050%), European (4.9%, a difference of 0.060%), Scandinavian (4.9%, a difference of 0.060%), Immigrants from Iraq (4.9%, a difference of 0.070%), and Immigrants from Sudan (4.9%, a difference of 0.13%).
| Demographics | Rating | Rank | Unemployment Among Seniors over 65 years |
| Immigrants | Kenya | 99.9 /100 | #49 | Exceptional 4.9% |
| Immigrants | Austria | 99.9 /100 | #50 | Exceptional 4.9% |
| Scotch-Irish | 99.9 /100 | #51 | Exceptional 4.9% |
| Swedes | 99.9 /100 | #52 | Exceptional 4.9% |
| Immigrants | Sudan | 99.8 /100 | #53 | Exceptional 4.9% |
| Immigrants | Iraq | 99.8 /100 | #54 | Exceptional 4.9% |
| Europeans | 99.8 /100 | #55 | Exceptional 4.9% |
| Carpatho Rusyns | 99.8 /100 | #56 | Exceptional 4.9% |
| Danes | 99.8 /100 | #57 | Exceptional 4.9% |
| Scandinavians | 99.8 /100 | #58 | Exceptional 4.9% |
| Immigrants | Eastern Africa | 99.7 /100 | #59 | Exceptional 4.9% |
| Immigrants | Middle Africa | 99.7 /100 | #60 | Exceptional 4.9% |
| Northern Europeans | 99.7 /100 | #61 | Exceptional 4.9% |
| Latvians | 99.6 /100 | #62 | Exceptional 4.9% |
| Croatians | 99.6 /100 | #63 | Exceptional 4.9% |
Demographics Similar to Shoshone by Unemployment Among Seniors over 65 years
In terms of unemployment among seniors over 65 years, the demographic groups most similar to Shoshone are Inupiat (5.8%, a difference of 0.43%), Bermudan (5.9%, a difference of 0.48%), Yuman (5.8%, a difference of 1.0%), Puerto Rican (5.9%, a difference of 1.0%), and Immigrants from Dominica (5.8%, a difference of 1.2%).
| Demographics | Rating | Rank | Unemployment Among Seniors over 65 years |
| Immigrants | Bangladesh | 0.0 /100 | #319 | Tragic 5.7% |
| Immigrants | Mexico | 0.0 /100 | #320 | Tragic 5.7% |
| British West Indians | 0.0 /100 | #321 | Tragic 5.8% |
| Natives/Alaskans | 0.0 /100 | #322 | Tragic 5.8% |
| Immigrants | Dominica | 0.0 /100 | #323 | Tragic 5.8% |
| Yuman | 0.0 /100 | #324 | Tragic 5.8% |
| Inupiat | 0.0 /100 | #325 | Tragic 5.8% |
| Shoshone | 0.0 /100 | #326 | Tragic 5.9% |
| Bermudans | 0.0 /100 | #327 | Tragic 5.9% |
| Puerto Ricans | 0.0 /100 | #328 | Tragic 5.9% |
| Dominicans | 0.0 /100 | #329 | Tragic 6.0% |
| Immigrants | Portugal | 0.0 /100 | #330 | Tragic 6.0% |
| Taiwanese | 0.0 /100 | #331 | Tragic 6.0% |
| Aleuts | 0.0 /100 | #332 | Tragic 6.0% |
| Immigrants | Dominican Republic | 0.0 /100 | #333 | Tragic 6.0% |