Scotch-Irish vs Spanish American Indian Unemployment Among Women with Children Under 6 years
COMPARE
Scotch-Irish
Spanish American Indian
Unemployment Among Women with Children Under 6 years
Unemployment Among Women with Children Under 6 years Comparison
Scotch-Irish
Spanish American Indians
8.4%
UNEMPLOYMENT AMONG WOMEN WITH CHILDREN UNDER 6 YEARS
0.3/ 100
METRIC RATING
263rd/ 347
METRIC RANK
8.7%
UNEMPLOYMENT AMONG WOMEN WITH CHILDREN UNDER 6 YEARS
0.0/ 100
METRIC RATING
283rd/ 347
METRIC RANK
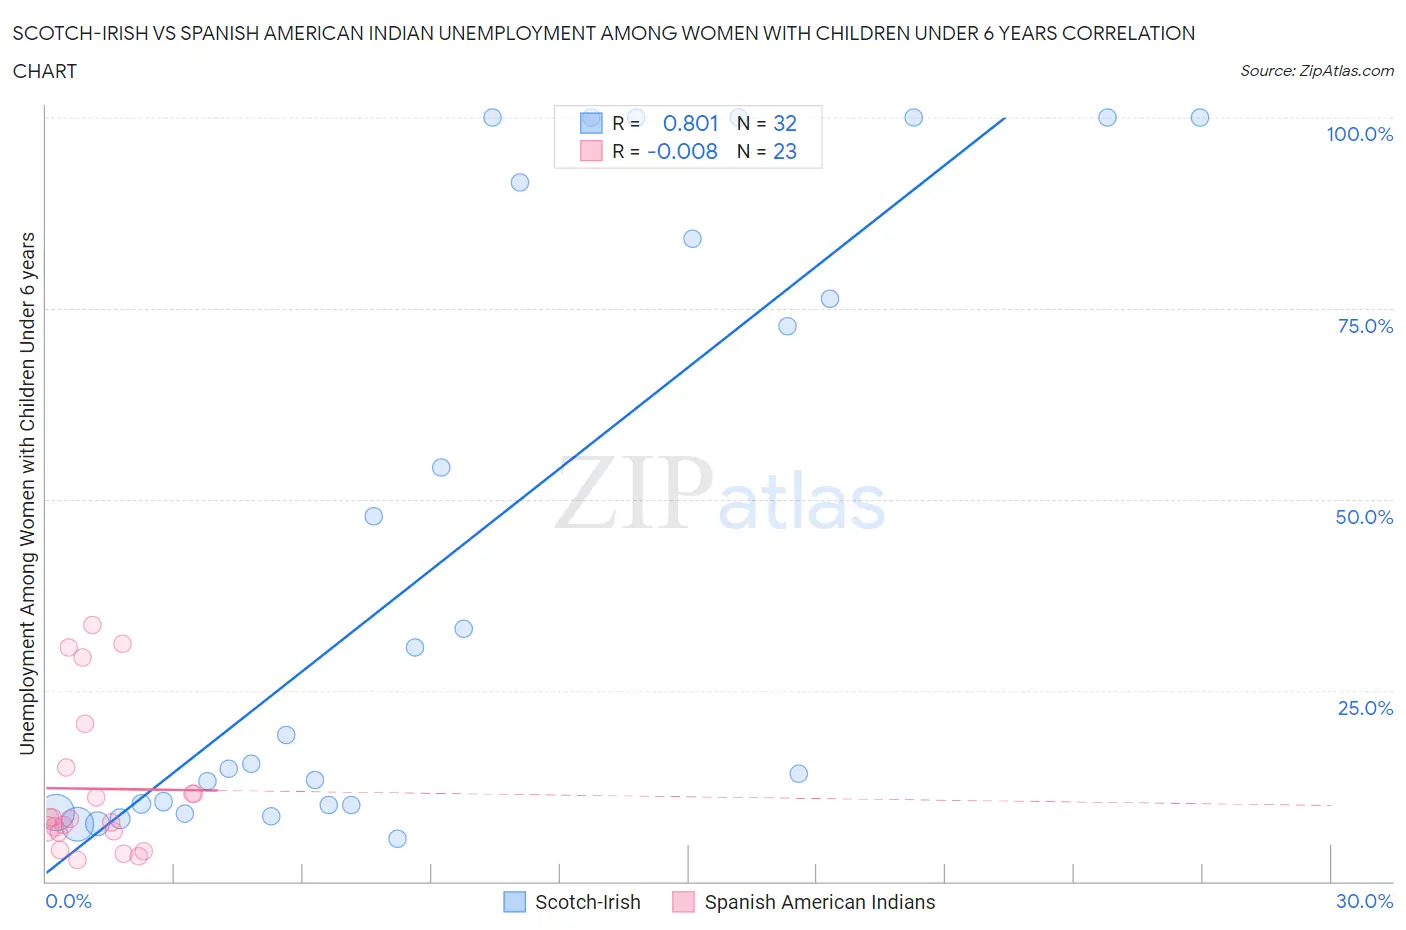
Scotch-Irish vs Spanish American Indian Unemployment Among Women with Children Under 6 years Correlation Chart
The statistical analysis conducted on geographies consisting of 365,350,902 people shows a very strong positive correlation between the proportion of Scotch-Irish and unemployment rate among women with children under the age of 6 in the United States with a correlation coefficient (R) of 0.801 and weighted average of 8.4%. Similarly, the statistical analysis conducted on geographies consisting of 68,967,895 people shows no correlation between the proportion of Spanish American Indians and unemployment rate among women with children under the age of 6 in the United States with a correlation coefficient (R) of -0.008 and weighted average of 8.7%, a difference of 3.3%.
Unemployment Among Women with Children Under 6 years Correlation Summary
| Measurement | Scotch-Irish | Spanish American Indian |
| Minimum | 5.6% | 2.8% |
| Maximum | 100.0% | 33.6% |
| Range | 94.4% | 30.8% |
| Mean | 43.0% | 12.1% |
| Median | 17.2% | 8.2% |
| Interquartile 25% (IQ1) | 10.0% | 6.3% |
| Interquartile 75% (IQ3) | 87.8% | 15.0% |
| Interquartile Range (IQR) | 77.9% | 8.6% |
| Standard Deviation (Sample) | 38.9% | 9.8% |
| Standard Deviation (Population) | 38.3% | 9.6% |
Demographics Similar to Scotch-Irish and Spanish American Indians by Unemployment Among Women with Children Under 6 years
In terms of unemployment among women with children under 6 years, the demographic groups most similar to Scotch-Irish are Honduran (8.4%, a difference of 0.020%), French Canadian (8.4%, a difference of 0.070%), Immigrants from Honduras (8.4%, a difference of 0.070%), Belizean (8.4%, a difference of 0.34%), and Subsaharan African (8.4%, a difference of 0.44%). Similarly, the demographic groups most similar to Spanish American Indians are Bermudan (8.7%, a difference of 0.020%), Guatemalan (8.7%, a difference of 0.11%), Immigrants from Belize (8.6%, a difference of 0.25%), Immigrants from Guatemala (8.6%, a difference of 0.29%), and Immigrants from Dominica (8.6%, a difference of 0.30%).
| Demographics | Rating | Rank | Unemployment Among Women with Children Under 6 years |
| Scotch-Irish | 0.3 /100 | #263 | Tragic 8.4% |
| Hondurans | 0.3 /100 | #264 | Tragic 8.4% |
| French Canadians | 0.3 /100 | #265 | Tragic 8.4% |
| Immigrants | Honduras | 0.3 /100 | #266 | Tragic 8.4% |
| Belizeans | 0.2 /100 | #267 | Tragic 8.4% |
| Sub-Saharan Africans | 0.2 /100 | #268 | Tragic 8.4% |
| Immigrants | Haiti | 0.2 /100 | #269 | Tragic 8.4% |
| Immigrants | Senegal | 0.2 /100 | #270 | Tragic 8.5% |
| Immigrants | Congo | 0.2 /100 | #271 | Tragic 8.5% |
| Mexican American Indians | 0.1 /100 | #272 | Tragic 8.5% |
| Slovaks | 0.1 /100 | #273 | Tragic 8.5% |
| Immigrants | Cameroon | 0.1 /100 | #274 | Tragic 8.6% |
| Immigrants | Latin America | 0.1 /100 | #275 | Tragic 8.6% |
| Yaqui | 0.0 /100 | #276 | Tragic 8.6% |
| Haitians | 0.0 /100 | #277 | Tragic 8.6% |
| Immigrants | Dominica | 0.0 /100 | #278 | Tragic 8.6% |
| Immigrants | Guatemala | 0.0 /100 | #279 | Tragic 8.6% |
| Immigrants | Belize | 0.0 /100 | #280 | Tragic 8.6% |
| Guatemalans | 0.0 /100 | #281 | Tragic 8.7% |
| Bermudans | 0.0 /100 | #282 | Tragic 8.7% |
| Spanish American Indians | 0.0 /100 | #283 | Tragic 8.7% |