Scotch-Irish vs Croatian Unemployment Among Women with Children Under 6 years
COMPARE
Scotch-Irish
Croatian
Unemployment Among Women with Children Under 6 years
Unemployment Among Women with Children Under 6 years Comparison
Scotch-Irish
Croatians
8.4%
UNEMPLOYMENT AMONG WOMEN WITH CHILDREN UNDER 6 YEARS
0.3/ 100
METRIC RATING
263rd/ 347
METRIC RANK
7.5%
UNEMPLOYMENT AMONG WOMEN WITH CHILDREN UNDER 6 YEARS
71.9/ 100
METRIC RATING
158th/ 347
METRIC RANK
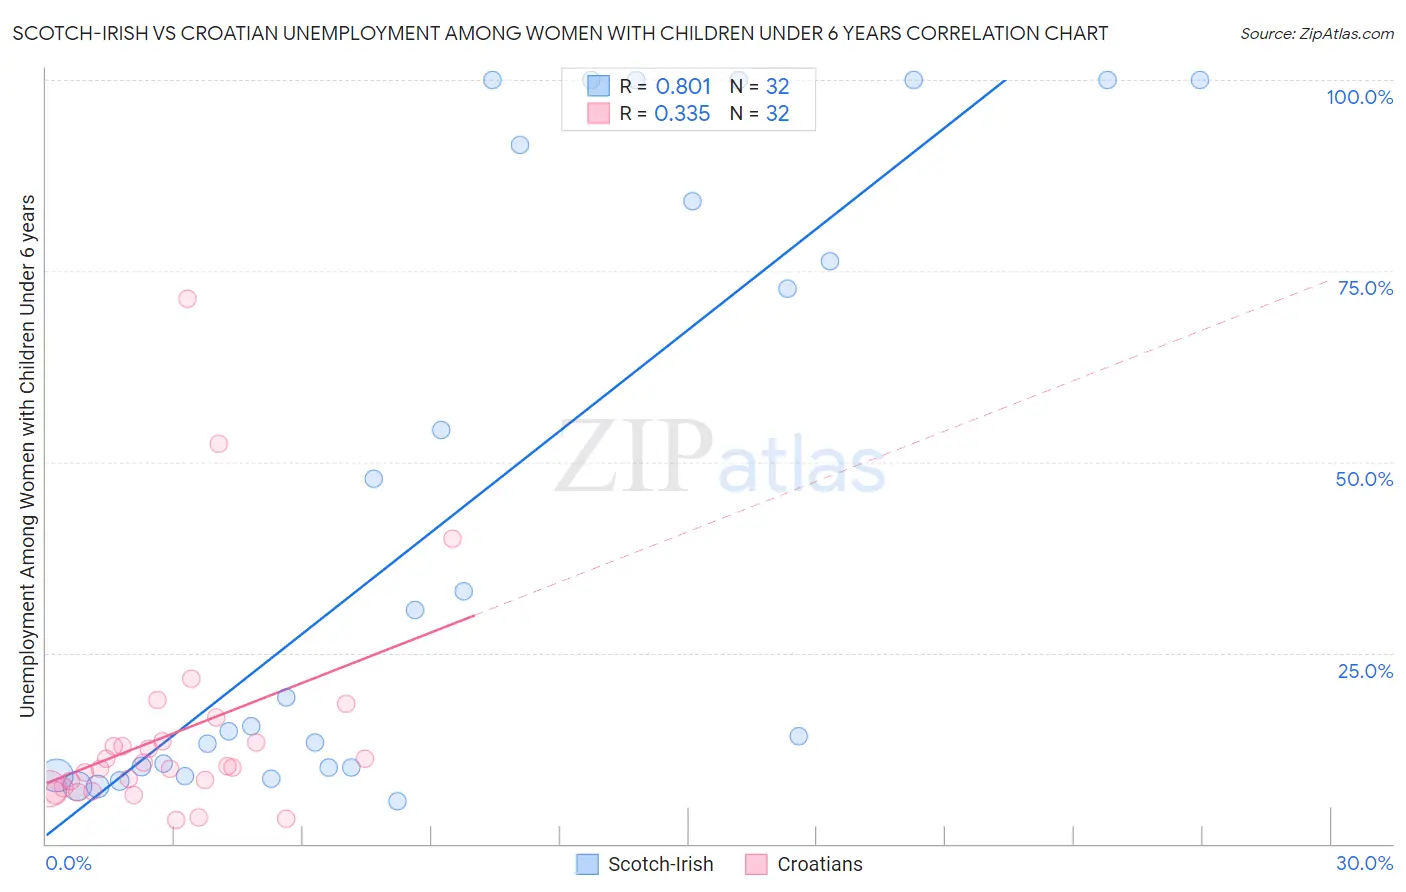
Scotch-Irish vs Croatian Unemployment Among Women with Children Under 6 years Correlation Chart
The statistical analysis conducted on geographies consisting of 365,350,902 people shows a very strong positive correlation between the proportion of Scotch-Irish and unemployment rate among women with children under the age of 6 in the United States with a correlation coefficient (R) of 0.801 and weighted average of 8.4%. Similarly, the statistical analysis conducted on geographies consisting of 279,151,645 people shows a mild positive correlation between the proportion of Croatians and unemployment rate among women with children under the age of 6 in the United States with a correlation coefficient (R) of 0.335 and weighted average of 7.5%, a difference of 11.5%.
Unemployment Among Women with Children Under 6 years Correlation Summary
| Measurement | Scotch-Irish | Croatian |
| Minimum | 5.6% | 3.1% |
| Maximum | 100.0% | 71.4% |
| Range | 94.4% | 68.3% |
| Mean | 43.0% | 14.4% |
| Median | 17.2% | 10.1% |
| Interquartile 25% (IQ1) | 10.0% | 7.3% |
| Interquartile 75% (IQ3) | 87.8% | 13.4% |
| Interquartile Range (IQR) | 77.9% | 6.1% |
| Standard Deviation (Sample) | 38.9% | 14.4% |
| Standard Deviation (Population) | 38.3% | 14.2% |
Similar Demographics by Unemployment Among Women with Children Under 6 years
Demographics Similar to Scotch-Irish by Unemployment Among Women with Children Under 6 years
In terms of unemployment among women with children under 6 years, the demographic groups most similar to Scotch-Irish are Honduran (8.4%, a difference of 0.020%), West Indian (8.4%, a difference of 0.030%), Immigrants from Liberia (8.4%, a difference of 0.040%), French Canadian (8.4%, a difference of 0.070%), and Immigrants from Honduras (8.4%, a difference of 0.070%).
| Demographics | Rating | Rank | Unemployment Among Women with Children Under 6 years |
| Celtics | 0.6 /100 | #256 | Tragic 8.3% |
| British West Indians | 0.5 /100 | #257 | Tragic 8.3% |
| Immigrants | Ghana | 0.5 /100 | #258 | Tragic 8.3% |
| Barbadians | 0.4 /100 | #259 | Tragic 8.3% |
| Whites/Caucasians | 0.3 /100 | #260 | Tragic 8.4% |
| Immigrants | Liberia | 0.3 /100 | #261 | Tragic 8.4% |
| West Indians | 0.3 /100 | #262 | Tragic 8.4% |
| Scotch-Irish | 0.3 /100 | #263 | Tragic 8.4% |
| Hondurans | 0.3 /100 | #264 | Tragic 8.4% |
| French Canadians | 0.3 /100 | #265 | Tragic 8.4% |
| Immigrants | Honduras | 0.3 /100 | #266 | Tragic 8.4% |
| Belizeans | 0.2 /100 | #267 | Tragic 8.4% |
| Sub-Saharan Africans | 0.2 /100 | #268 | Tragic 8.4% |
| Immigrants | Haiti | 0.2 /100 | #269 | Tragic 8.4% |
| Immigrants | Senegal | 0.2 /100 | #270 | Tragic 8.5% |
Demographics Similar to Croatians by Unemployment Among Women with Children Under 6 years
In terms of unemployment among women with children under 6 years, the demographic groups most similar to Croatians are Peruvian (7.5%, a difference of 0.030%), Immigrants from Philippines (7.5%, a difference of 0.050%), Bolivian (7.5%, a difference of 0.090%), Immigrants from Southern Europe (7.5%, a difference of 0.11%), and Immigrants from Western Asia (7.5%, a difference of 0.14%).
| Demographics | Rating | Rank | Unemployment Among Women with Children Under 6 years |
| Immigrants | Peru | 74.9 /100 | #151 | Good 7.5% |
| Bangladeshis | 74.8 /100 | #152 | Good 7.5% |
| Uruguayans | 74.7 /100 | #153 | Good 7.5% |
| Northern Europeans | 74.3 /100 | #154 | Good 7.5% |
| South Americans | 74.1 /100 | #155 | Good 7.5% |
| Immigrants | Southern Europe | 73.2 /100 | #156 | Good 7.5% |
| Peruvians | 72.3 /100 | #157 | Good 7.5% |
| Croatians | 71.9 /100 | #158 | Good 7.5% |
| Immigrants | Philippines | 71.3 /100 | #159 | Good 7.5% |
| Bolivians | 70.8 /100 | #160 | Good 7.5% |
| Immigrants | Western Asia | 70.2 /100 | #161 | Good 7.5% |
| Immigrants | Lithuania | 68.8 /100 | #162 | Good 7.5% |
| British | 66.3 /100 | #163 | Good 7.6% |
| Ugandans | 65.8 /100 | #164 | Good 7.6% |
| Immigrants | South America | 65.6 /100 | #165 | Good 7.6% |